
The Enterprise Guide to Unified Data Models, Ontologies, and Knowledge Graphs
If you spend enough time in enterprise data architecture, you will inevitably drown in a sea of buzzwords. Ontology. Knowledge Graph. Semantic Layer. Context Layer. Unified Data Model.
Companies often use these terms interchangeably, treating them as synonyms for “smart data.” But they are not synonyms. They are distinct, sequential building blocks. If you confuse a Semantic Layer with a Knowledge Graph, your enterprise AI initiatives will fail before they even start.
Let’s strip away the theory. We are going to look at what these terms actually mean, how they differ, and the exact sequence in which you build them, using a real-world enterprise scenario: Uncovering a Multi-Million Dollar Fraud Ring at a Tier-1 Bank.
The Real-World Scenario: Catching “Synthetic” Criminals
Imagine a sophisticated fraud ring targeting a bank. The criminals use a mix of stolen Social Security Numbers and fake names to create “synthetic identities” enabling fake people that look completely legitimate on paper.
Let’s introduce our prime suspect: John Doe. On paper, John is a highly profitable customer. He opened an account, built a solid credit history, and always pays his minimums on time. But John isn’t real. He is a synthetic identity, meticulously cultivated by a fraud ring to max out a $50,000 loan and vanish.
To catch synthetic criminals like John Doe before they disappear with the funds, the bank needs to build an advanced, relationship-aware AI system. Here is the exact architectural sequence we must follow.
Step 1: The Unified Data Model (UDM)
What it is: The foundation. It is the standardized schema that integrates raw, messy data from dozens of different source systems into a single, consistent format.
The Function: Structure and Storage.
In Our Scenario:
The bank has data scattered everywhere. The mortgage system calls a customer client_no. The credit card system calls them cust_id. The UDM maps all of this into a single, unified, flat table. Now, whether John Doe applies for a credit card or a car loan, the bank recognizes him under a single CustomerID. It standardizes his date of birth, currency types, and physical address.
The Limitation: The UDM is flat. It can easily tell you what transactions John Doe made, but it is terrible at showing you who John Doe is connected to.
Step 2: The Ontology
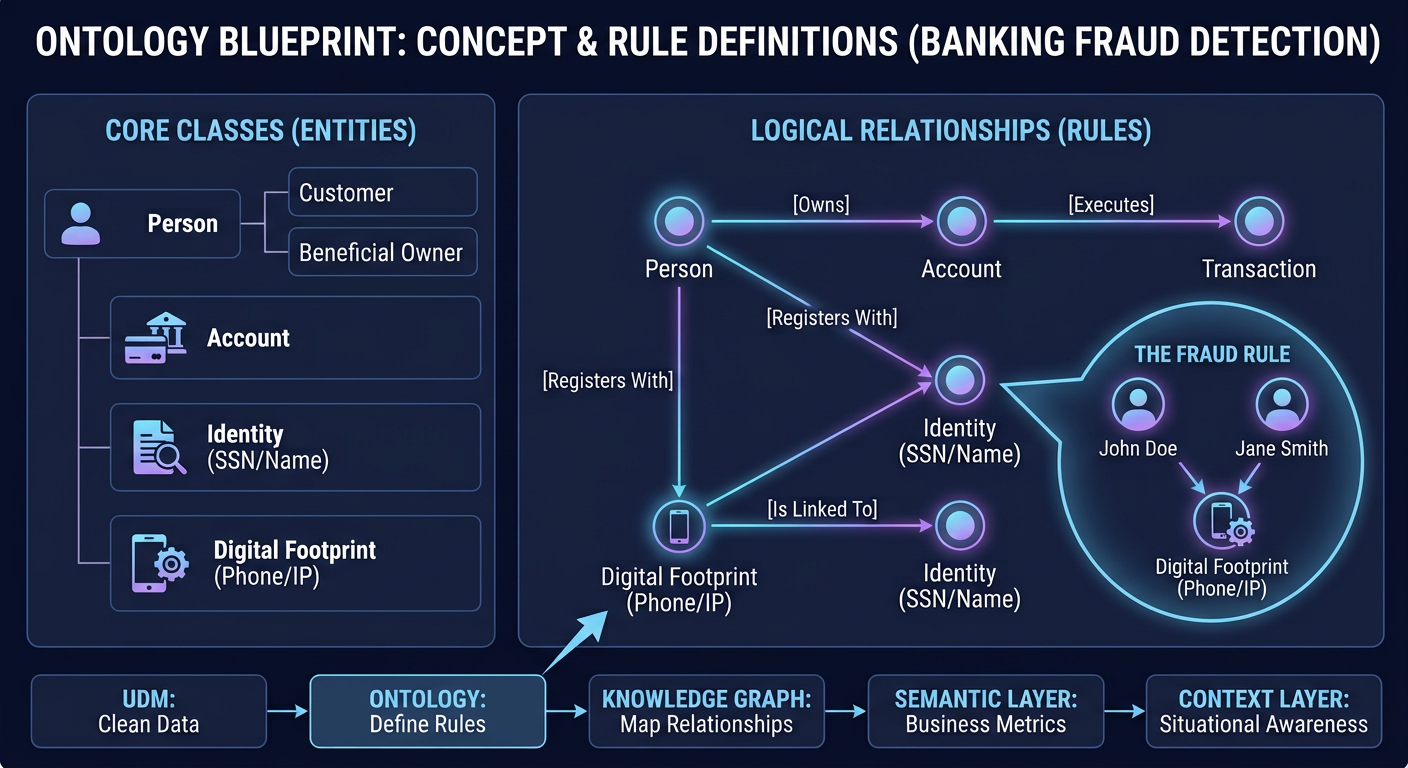
What it is: The Blueprint. An ontology is a formal, logical map of the concepts in the business domain and the rules of how they relate to each other.
The Function: Definition and Rules.
In Our Scenario:
Before we can map the fraud ring, we have to teach the computer how a bank actually works. The Ontology defines the rules of the business:
- A Person
[Owns]an Account. - An Account
[Executes]a Transaction. - A Person
[Registers With]a Phone Number and an IP Address.
The Difference: The UDM holds actual data (rows and columns). The Ontology holds zero actual data. It is purely the philosophical blueprint. It doesn’t know who John Doe is; it only knows that if a Person exists, they must be capable of owning an Account.
Step 3: The Knowledge Graph
What it is: The Instantiation. A Knowledge Graph takes the actual data from your UDM and pours it into the blueprint of your Ontology, turning flat rows into a web of nodes (entities) and edges (relationships).
The Function: Relationship Mapping.
In Our Scenario:
This is where we catch the fraud ring. We feed our customer data into the graph. Suddenly, the system sees the hidden network:
- John Doe
[Registers With]Phone Number 555-0199. - Jane Smith
[Registers With]Phone Number 555-0199. - Alex Jones
[Logs In From]IP Address 192.168.x.x… which was also used by John Doe.
The Difference: A traditional flat database tells you John, Jane, and Alex all have excellent credit scores. The Knowledge Graph tells you they are secretly sharing a single burner phone and IP address which is the classic, undeniable footprint of a synthetic identity fraud ring.
Step 4: The Semantic Layer
What it is: The Translator. An abstraction layer that sits between complex data structures (like our graph) and the business users. It translates complex query code into simple business terms.
The Function: Business Accessibility.
In Our Scenario:
The Chief Risk Officer doesn’t know how to write a complex, 5-hop graph query to find fraud rings. So, the data engineering team builds a Semantic Layer. They write the complex code once, and define it simply as a business metric called High_Risk_Synthetic_Customer.
Now, when the Risk Officer opens their dashboard or asks an AI Chatbot, “Show me all high-risk customers,” the Semantic Layer intercepts that plain English, translates it into the complex graph query, and immediately flags John Doe.
The Difference: The Knowledge Graph finds the relationship. The Semantic Layer makes it consumable by a non-technical human or standard BI tool.
Step 5: The Context Layer
What it is: The Situational Engine. This is the top tier, often used by GenAI and Agentic workflows. It applies real-time situational, temporal (time-based), and environmental awareness to the data.
The Function: Real-Time Decision Making.
In Our Scenario:
The Knowledge Graph knows John Doe is linked to a fraud ring. The Semantic Layer labels him High_Risk. But the Context Layer knows what John Doe is doing right now.
It detects that John is currently logged in, it’s 3:00 AM in his registered time zone, his geolocation indicates he is in a high-risk country, and he is attempting to wire $50,000 to an offshore account.
Because the Context Layer understands the immediate situation, it triggers an autonomous Agentic AI to instantly freeze the wire transfer and alert the compliance team before the money leaves the bank.
Key Takeaway: The Order of Operations
To build enterprise AI that actually works, you cannot skip steps. You must build in this sequence:
- UDM: Clean and standardize the raw data.
- Ontology: Define the business rules and relationships logically.
- Knowledge Graph: Populate those rules with your real data to expose hidden networks.
- Semantic Layer: Translate that complex network into simple metrics for business users.
- Context Layer: Apply real-time situational awareness to drive automated, AI-led decisions.
Build the foundation first, and the AI will follow.

