The Enterprise Guide to Unified Data Models, Ontologies, and Knowledge Graphs

If you spend enough time in enterprise data architecture, you will inevitably drown in a sea of buzzwords. Ontology. Knowledge Graph. Semantic Layer. Context Layer. Unified Data Model.

Companies often use these terms interchangeably, treating them as synonyms for “smart data.” But they are not synonyms. They are distinct, sequential building blocks. If you confuse a Semantic Layer with a Knowledge Graph, your enterprise AI initiatives will fail before they even start.

Let’s strip away the theory. We are going to look at what these terms actually mean, how they differ, and the exact sequence in which you build them, using a real-world enterprise scenario: Uncovering a Multi-Million Dollar Fraud Ring at a Tier-1 Bank.

The Real-World Scenario: Catching “Synthetic” Criminals

Imagine a sophisticated fraud ring targeting a bank. The criminals use a mix of stolen Social Security Numbers and fake names to create “synthetic identities” enabling fake people that look completely legitimate on paper.

Let’s introduce our prime suspect: John Doe. On paper, John is a highly profitable customer. He opened an account, built a solid credit history, and always pays his minimums on time. But John isn’t real. He is a synthetic identity, meticulously cultivated by a fraud ring to max out a $50,000 loan and vanish.

To catch synthetic criminals like John Doe before they disappear with the funds, the bank needs to build an advanced, relationship-aware AI system. Here is the exact architectural sequence we must follow.

Step 1: The Unified Data Model (UDM)

What it is: The foundation. It is the standardized schema that integrates raw, messy data from dozens of different source systems into a single, consistent format.
The Function: Structure and Storage.

In Our Scenario:
The bank has data scattered everywhere. The mortgage system calls a customer client_no. The credit card system calls them cust_id. The UDM maps all of this into a single, unified, flat table. Now, whether John Doe applies for a credit card or a car loan, the bank recognizes him under a single CustomerID. It standardizes his date of birth, currency types, and physical address.

The Limitation: The UDM is flat. It can easily tell you what transactions John Doe made, but it is terrible at showing you who John Doe is connected to.

Step 2: The Ontology

What it is: The Blueprint. An ontology is a formal, logical map of the concepts in the business domain and the rules of how they relate to each other.
The Function: Definition and Rules.

In Our Scenario:
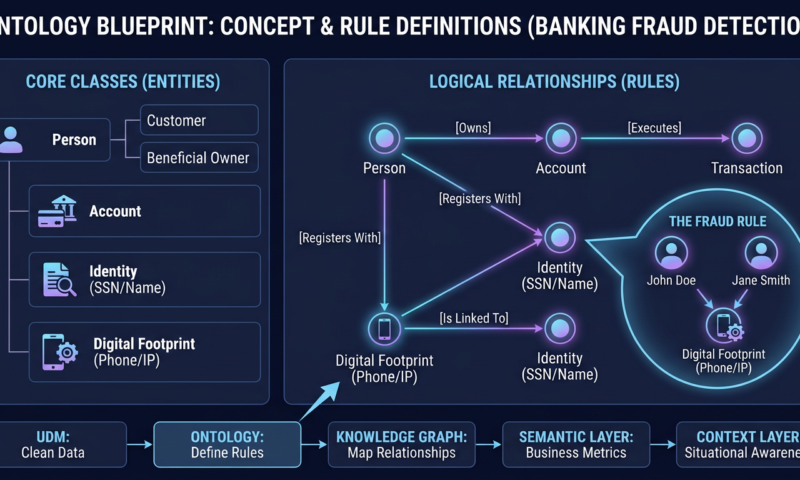
Before we can map the fraud ring, we have to teach the computer how a bank actually works. The Ontology defines the rules of the business:

  • Person [Owns] an Account.
  • An Account [Executes] a Transaction.
  • Person [Registers With] a Phone Number and an IP Address.

The Difference: The UDM holds actual data (rows and columns). The Ontology holds zero actual data. It is purely the philosophical blueprint. It doesn’t know who John Doe is; it only knows that if a Person exists, they must be capable of owning an Account.

Step 3: The Knowledge Graph

What it is: The Instantiation. A Knowledge Graph takes the actual data from your UDM and pours it into the blueprint of your Ontology, turning flat rows into a web of nodes (entities) and edges (relationships).
The Function: Relationship Mapping.

In Our Scenario:
This is where we catch the fraud ring. We feed our customer data into the graph. Suddenly, the system sees the hidden network:

  • John Doe [Registers With] Phone Number 555-0199.
  • Jane Smith [Registers With] Phone Number 555-0199.
  • Alex Jones [Logs In From] IP Address 192.168.x.x… which was also used by John Doe.

The Difference: A traditional flat database tells you John, Jane, and Alex all have excellent credit scores. The Knowledge Graph tells you they are secretly sharing a single burner phone and IP address which is the classic, undeniable footprint of a synthetic identity fraud ring.

Step 4: The Semantic Layer

What it is: The Translator. An abstraction layer that sits between complex data structures (like our graph) and the business users. It translates complex query code into simple business terms.
The Function: Business Accessibility.

In Our Scenario:
The Chief Risk Officer doesn’t know how to write a complex, 5-hop graph query to find fraud rings. So, the data engineering team builds a Semantic Layer. They write the complex code once, and define it simply as a business metric called High_Risk_Synthetic_Customer.
Now, when the Risk Officer opens their dashboard or asks an AI Chatbot, “Show me all high-risk customers,” the Semantic Layer intercepts that plain English, translates it into the complex graph query, and immediately flags John Doe.

The Difference: The Knowledge Graph finds the relationship. The Semantic Layer makes it consumable by a non-technical human or standard BI tool.

Step 5: The Context Layer

What it is: The Situational Engine. This is the top tier, often used by GenAI and Agentic workflows. It applies real-time situational, temporal (time-based), and environmental awareness to the data.
The Function: Real-Time Decision Making.

In Our Scenario:
The Knowledge Graph knows John Doe is linked to a fraud ring. The Semantic Layer labels him High_Risk. But the Context Layer knows what John Doe is doing right now.
It detects that John is currently logged in, it’s 3:00 AM in his registered time zone, his geolocation indicates he is in a high-risk country, and he is attempting to wire $50,000 to an offshore account.

Because the Context Layer understands the immediate situation, it triggers an autonomous Agentic AI to instantly freeze the wire transfer and alert the compliance team before the money leaves the bank.
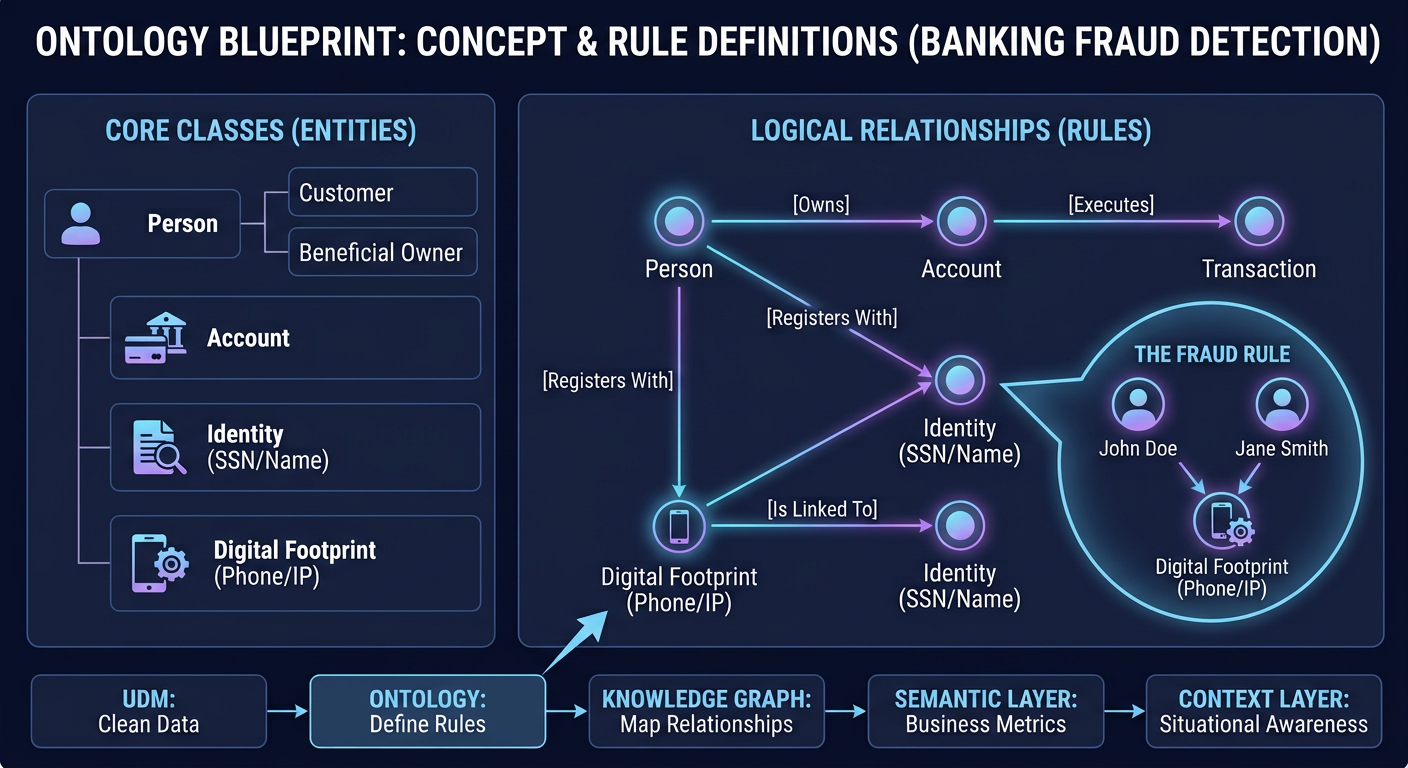
Key Takeaway: The Order of Operations

To build enterprise AI that actually works, you cannot skip steps. You must build in this sequence:

  1. UDM: Clean and standardize the raw data.
  2. Ontology: Define the business rules and relationships logically.
  3. Knowledge Graph: Populate those rules with your real data to expose hidden networks.
  4. Semantic Layer: Translate that complex network into simple metrics for business users.
  5. Context Layer: Apply real-time situational awareness to drive automated, AI-led decisions.

Build the foundation first, and the AI will follow.

Agentic AI Is Not Just Multi-Threading With a Fancy Hat

A friendly reality check for developers who’ve been there, coded that

If you’ve spent years writing Java or C#, your brain has a beautiful superpower: you see new problems through the lens of patterns you already know. Concurrency, thread pools, executors – these are your comfort zone. So when someone says “AI agents run multiple tasks in parallel”, your brain fires up the old mental model: oh, so it’s like threads. Got it.

Totally understandable. And also, respectfully, kind of wrong. Not completely wrong, but wrong enough that it’ll trip you up when you try to actually build or work with agentic AI systems.

Let’s fix that, with zero jargon and a bunch of real examples.

What Even Is Agentic AI?

Regular AI, like a basic chatbot or a GPT prompt, is reactive. You give it an input, it gives you an output. One shot. Done.

Agentic AI is proactive. You give it a goal, and it figures out the steps, uses tools, makes decisions, and keeps going until the job is done or it hits a wall and asks you for help.

Think of it like this: regular AI is a vending machine. Agentic AI is an intern with a to-do list, a laptop, and access to your company Slack.

Here’s a concrete example. You tell an agent:

“Find all enterprise deals stuck in our CRM for more than 30 days, draft a follow-up email for each, and flag the ones where the last touchpoint was a competitor mention.”

The agent will: hit your CRM API, filter records, pull deal history, analyse notes, draft personalised emails, and return a prioritised list with drafts attached. You didn’t tell it how. You told it what, and it figured out the rest.

The Multi-Threading Trap

Here’s why the multi-threading analogy feels right at first: agentic systems do sometimes run things in parallel. Multiple agents can work simultaneously: one researching, one writing, one fact-checking. That part looks familiar.

But that’s where the similarity ends. Here’s the full picture:

 Multi-threading Agentic AI
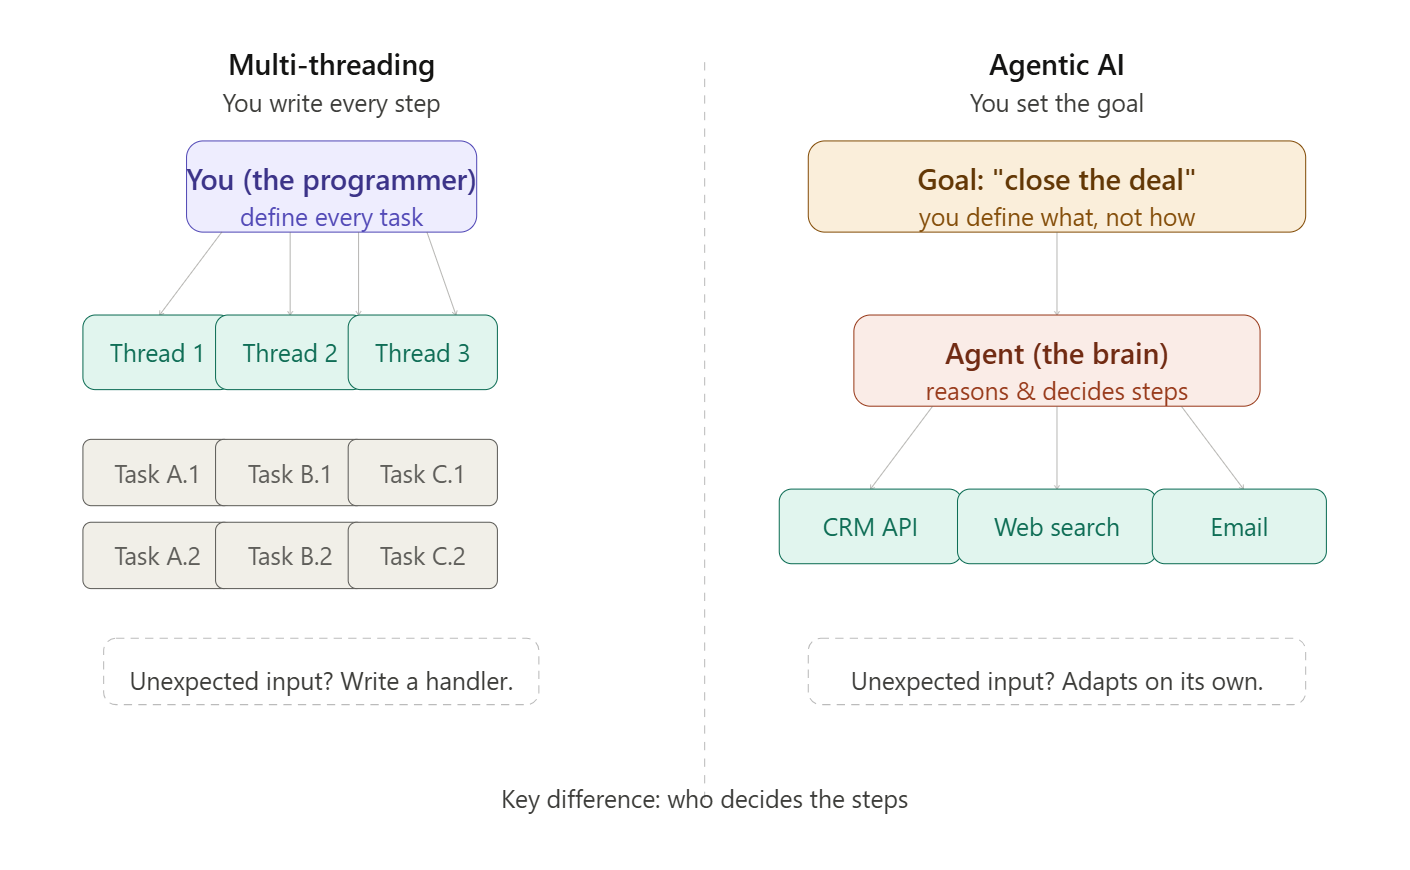
Who decides the steps?You (the programmer)The agent itself
Does it run in parallel?Yes, explicitlySometimes, not the point
Goal-driven?NoYes, core feature
Handles surprises?No, needs coded logicYes, adapts dynamically
Uses external tools?NoYes, APIs, browsers, DBs
Can it reason?NoYes, that’s the whole game

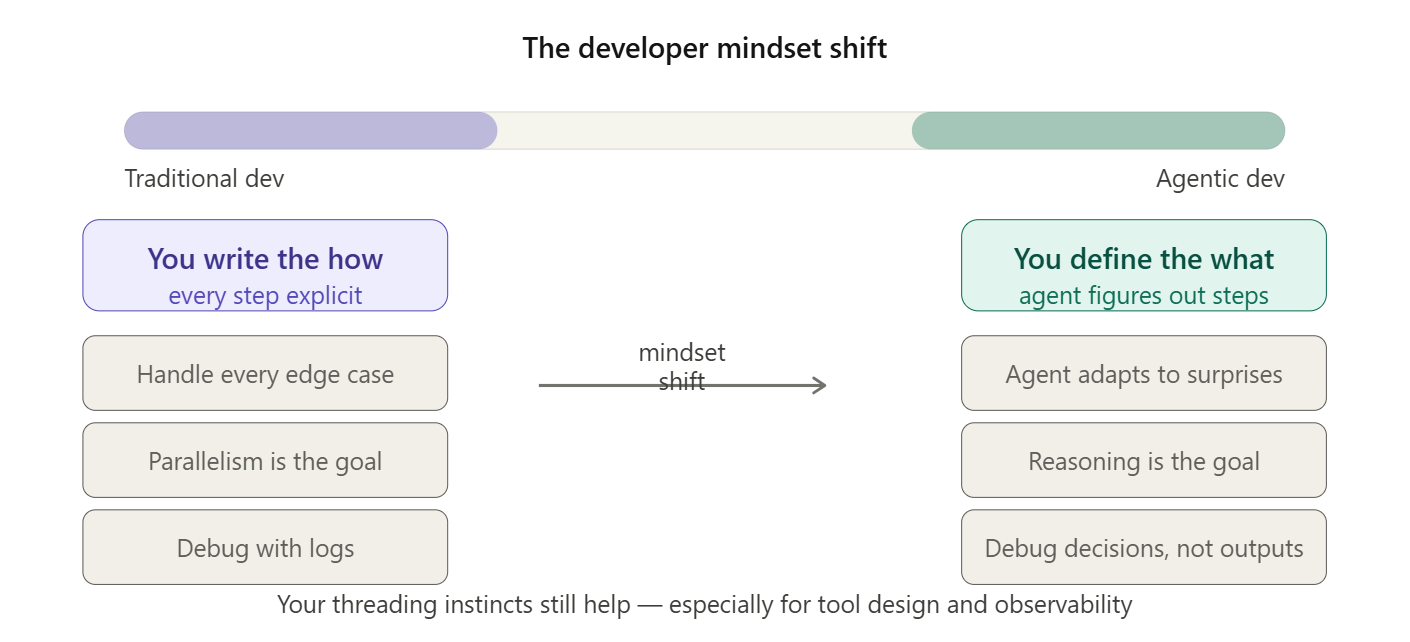
The killer difference? In multi-threading, you’re still the brain. You decide what each thread does. You write every decision point. If something unexpected happens, you have to handle it in code like a try/catch, a fallback, a retry loop. In agentic AI, the agent is the brain. It reads the situation, decides what to do next, and adapts when things go sideways without you writing that logic explicitly.

Real Enterprise Example:

A manufacturing company has an agent connected to SAP, email, and their supplier database. When inventory for a critical component drops below threshold, the agent doesn’t just notify someone, it checks current supplier pricing, compares lead times, drafts a purchase order, and routes it for human approval only if the amount exceeds a set limit.

Multi-threading version: A scheduled job polls inventory levels and triggers a notification. A human logs in, checks prices manually, creates the PO.

Agentic version: The agent handles the entire decision chain. You just approve.

“Okay, But What About Multi-Agent Systems?”

Now you’re asking the right question. When you have multiple agents working together, it does start looking more like multi-threading in structure, at least.

  • Agent A pulls and cleans raw data from your data warehouse
  • Agent B runs competitive analysis using web search
  • Agent C synthesises both into an executive briefing
  • All three run concurrently. Results merge at the end.

Sound familiar? It should. But here’s the key: each agent is still reasoning about its task, not just executing pre-written logic. If Agent B hits a paywalled article, it doesn’t crash – it finds an alternative source. If Agent C gets conflicting inputs, it flags the contradiction rather than blindly merging.

The parallelism is real. But the intelligence inside each “thread” is what makes it different.

TL;DR

Multi-threading: you write the what AND the how, then parallelise the execution.

Agentic AI: you write the what, the agent figures out the how, and adapts when reality doesn’t match the plan.

When Bad Data Becomes the Real Enemy: Data Quality Issues That Can Sink Enterprise AI Projects

Enterprise organizations are investing billions in AI, analytics, and automation. But despite advanced AI models, cloud platforms, and state-of-the-art analytics tools, most companies still struggle with one fundamental issue:

Bad data – not bad models – is the #1 reason AI and analytics initiatives fail.

In fact, mislabeled, inconsistent, siloed, or incomplete data can derail projects long before they reach production. Understanding and fixing data quality issues isn’t a side project – it’s the foundation of responsible, reliable, and repeatable AI.

Why Data Quality Matters More Than You Think

You might assume that data problems are just “technical nuisances.” In reality, poor data quality:

  • Skews analytics outputs
  • Produces biased AI models
  • Wastes resources in retraining and debugging
  • Creates governance, compliance, and operational risks
  • Slows or blocks AI adoption entirely – up to 77% of organizations report data quality issues blocking enterprise AI deployments.

The 9 Most Common Data Quality Issues

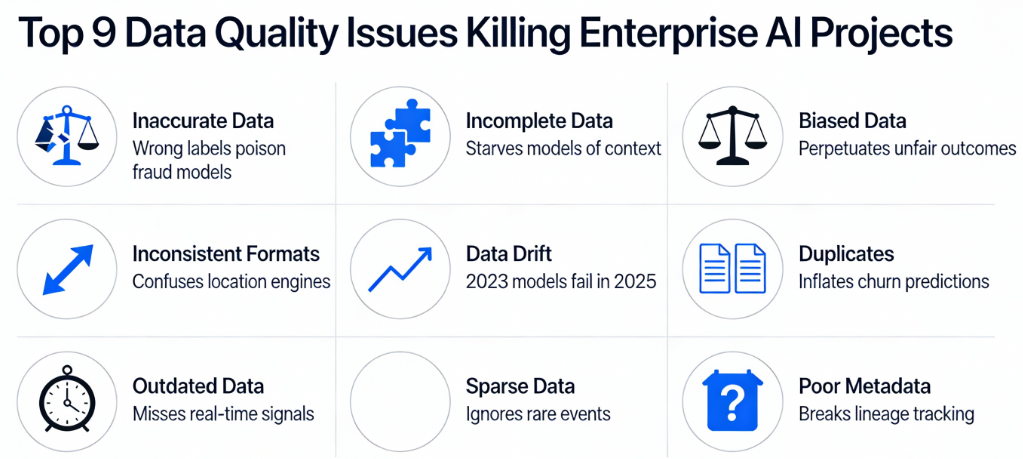
These issues are drawn from industry research and practitioner experience and they show why even the most ambitious AI initiatives can go off the rails.

1. Inaccurate, Incomplete, or Improperly Labeled Data

Problem: Models trained on incorrect or missing values will produce flawed outputs – sometimes in subtle and dangerous ways.

Example:
A retail company rolling out demand forecasting found its AI model consistently overestimated sales. The reason? Product attributes were inconsistent across channels, and key stock-keeping units (SKUs) were missing price history. The result: overproduction and increased inventory write-offs.

Lesson:
Before modeling, data must be validated for truthfulness and completeness and not just quantity.

2. Too Much Data (Noise Overload)

Problem: More data isn’t always better. Large datasets may include irrelevant or noisy data that confuses learning algorithms rather than helping them.

Example:
A global bank collected customer transaction data from multiple geographies but failed to filter inconsistencies. Instead of improving credit risk predictions, the model learned patterns from inconsistent labeling standards in different regions, reducing its accuracy.

Lesson:
Curate, filter, and focus your datasets – bigger isn’t always better.

3. Too Little or Unrepresentative Data

Problem: Small or narrow datasets result in models that fail to generalize to real-world scenarios.

Example:
A healthcare analytics initiative to detect rare diseases had plenty of records for common conditions, but only a handful for the target condition. The model overfit to the common classes and failed to detect real cases.

Lesson:
Ensure your training data is representative of the full problem space.

4. Biased & Unbalanced Data

Problem: Models trained on skewed samples inherit bias, leading to unfair or incorrect outputs.

Example:
A hiring tool was trained on historical candidate data which reflected past hiring biases. The AI began to replicate those biases, ranking similar candidates unfairly.

Lesson:
Detect and correct bias early through sampling and fairness audits.

5. Data Silos Across the Organization

Problem: When teams or departments hoard data in separate systems, models lack a unified view of the enterprise context.

Example:
A global insurer with separate regional databases struggled to build a unified AI model. Customer risk profiles differed simply because regional teams measured metrics differently. The result? Inconsistent underwriting decisions and regulatory alarms.

Lesson:
Break silos with enterprise-wide data standardization and governance.

6. Inconsistent Data Across Systems

Problem: Same entities may be represented differently across systems causing mismatches that cascade into analytics errors.

Example:
A multinational consumer packaged goods company found that customer identifiers were inconsistent between CRM, ERP, and sales systems. The result was flawed customer segmentation and misdirected marketing spend.

Lesson:
Establish universal identifiers and shared data dictionaries.

7. Data Sparsity (Missing Values)

Problem: Data sparsity arises when expected values are missing – a common challenge in big enterprise datasets.

Example:
A predictive maintenance model for industrial equipment failed because many sensor values were sporadically missing leading to unreliable predictions and frequent false alarms.

Lesson:
Invest in data completeness checks and fallback imputations.

8. Labeling Issues

Problem: Training data must be correctly tagged or annotated; otherwise, models learn the wrong signals.

Example:
In an AI customer sentiment project, product reviews were labeled incorrectly due to inconsistent annotation standards leading the model to misclassify sentiments by a significant margin.

Lesson:
Rigorous labeling protocols and consensus among annotators improve model reliability.

9. “Too Fast, Too Loose” Integration of Synthetic or Noisy Data

Problem: Using synthetic data without proper controls can amplify noise and bias in models.

Example:
An enterprise used auto-generated customer profiles to augment scarce training data. Instead of improving performance, the model learned artificial patterns that didn’t exist in real behavior reducing real-world accuracy.

Lesson:
Balance synthetic data with real, high‐fidelity datasets.

Enterprise Impact: It’s Not Just About Models; It’s About Business Outcomes

Poor data quality isn’t just a data team problem – it has real business costs and strategic implications:

Financial Losses and Failed Projects

  • Organizations with poor data quality spend millions each year remediating data and fixing failed AI initiatives.

Competitive Disadvantage

Teams with reliable, governed data outperform competitors by:

  • Faster AI deployments
  • Better customer insights
  • Higher operational efficiency

Regulatory and Compliance Risks

In industries like finance and healthcare, data quality issues can lead to misreporting and legal penalties.

Best Practices to Mitigate Data Quality Risks

  1. Early Profiling and Quality Checks
    Start with data profiling before modeling begins.
  2. Centralized Governance
    Break silos with strong governance, shared definitions, and quality standards.
  3. Automated Validation in Pipelines
    Use validation tools and anomaly detection in ETL pipelines.
  4. Bias and Fairness Audits
    Regularly test models for skew and bias.
  5. Continuous Monitoring Post-Deployment
    Data drift can make even previously high-quality data degrade over time – monitor and retrain as necessary.

Data Quality Is Business Quality

Investments in AI and analytics are only as effective as the data that feeds them. High-quality data enhances trust, scalability, and business outcomes. Poor quality data, on the other hand, drains resources, undermines confidence, and derails innovation.

In the modern enterprise, data quality isn’t a technical challenge – it’s a strategic imperative.

Sankey Diagrams Explained: How Global Companies Use Flow Visuals to Tell Powerful Business Stories

Annual reports are packed with numbers but the smartest companies know that how you visualize those numbers often matters more than the numbers themselves.

One visualization that quietly delivers disproportionate insight is the Sankey diagram.

From energy flows to revenue allocation, carbon emissions to cash movement, Sankey diagrams help executives and analysts answer one deceptively simple question:

“Where is everything really going?”

In this article, we’ll break down:

  • What a Sankey diagram is (in simple terms)
  • How it’s constructed
  • Why it’s uniquely powerful
  • How global companies use it in annual reports
  • What insights you can extract that tables and bar charts simply can’t

What is a Sankey Diagram?

A Sankey diagram is a flow diagram where:

  • Nodes represent categories or stages
  • Links (flows) represent movement between them
  • The width of each flow is proportional to quantity

In other words:

Thicker flow = more volume / value

Unlike traditional charts that show levels, Sankey diagrams show movement and distribution.

Why Sankey Diagrams Are So Powerful

Most charts answer:

  • How much?
  • How many?
  • How did this change over time?

Sankey diagrams answer:

  • Where did it come from?
  • Where did it go next?
  • How much was lost, retained, or transformed along the way?

They are especially effective when:

  • Inputs split into many outputs
  • Outputs originate from many inputs
  • You want to expose inefficiencies, concentration, or leakage

Anatomy of a Sankey Diagram

Let’s break it down:

1. Nodes

These are the stages or entities in the flow.

  • Revenue sources
  • Cost categories
  • Energy types
  • Regions
  • Business units

2. Flows (Links)

  • Connect one node to another
  • Width is proportional to value (money, energy, emissions, users, etc.)

3. Conservation Principle

In most Sankey diagrams:

Total input = Total output (after splits)

This makes discrepancies and losses immediately visible.

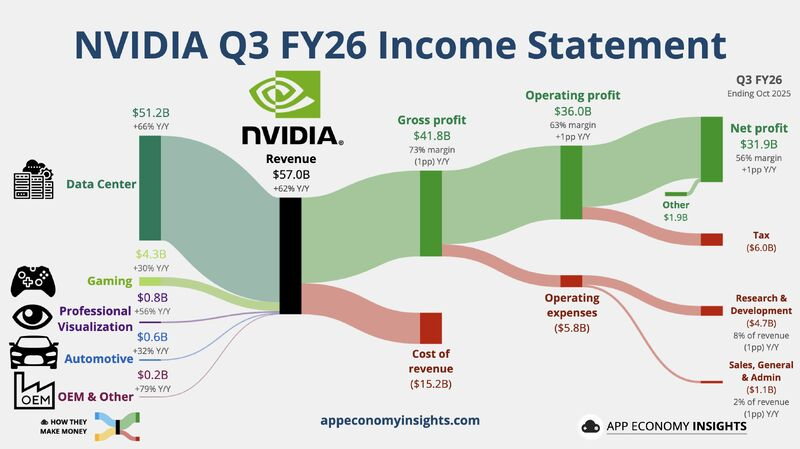
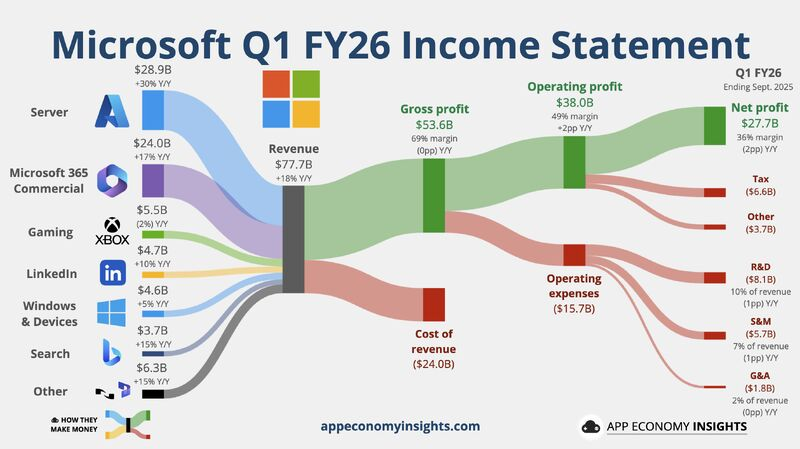
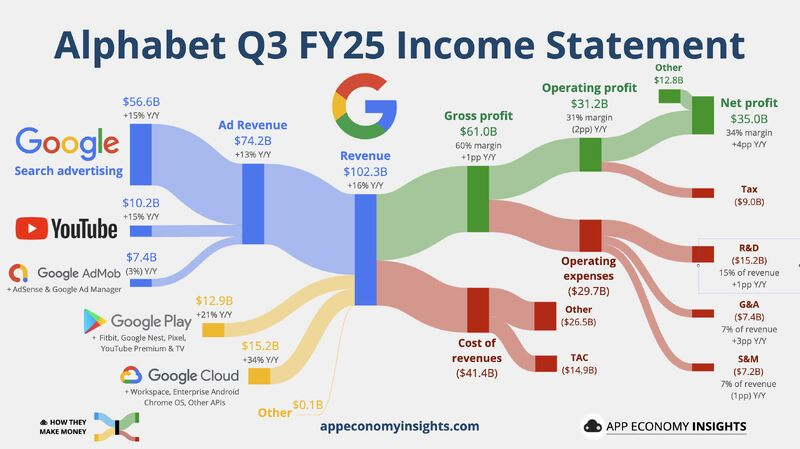
Example: Revenue & Profit Flow – NVIDIA (Annual Report Perspective)

Use case: Revenue generation → business segments → cost allocation → operating profit

Typical Sankey Structure

Inputs (Revenue Sources)

  • Gaming
  • Data Center
  • Professional Visualization
  • Automotive
  • OEM & Other

Transformation (Value Creation & Cost Absorption)

  • Compute & Networking platforms
  • Graphics & GPU platforms
  • AI software & ecosystem investments
  • R&D expenditure
  • Manufacturing & supply chain costs
  • Sales, marketing & administrative overheads

Outputs (Financial Outcomes)

  • Cost of Revenue
  • Operating Expenses
  • Operating Income (Profit)
  • Reinvestment into R&D

Key Insights

  • Data Center flows dominate profit output, not just revenue input.
  • Gaming contributes stable inflow but proportionally less to profit growth.
  • R&D absorbs a thick, consistent flow across all revenue streams, signaling long-term moat building.
  • Automotive and OEM flows remain thin, reflecting optionality rather than current scale.

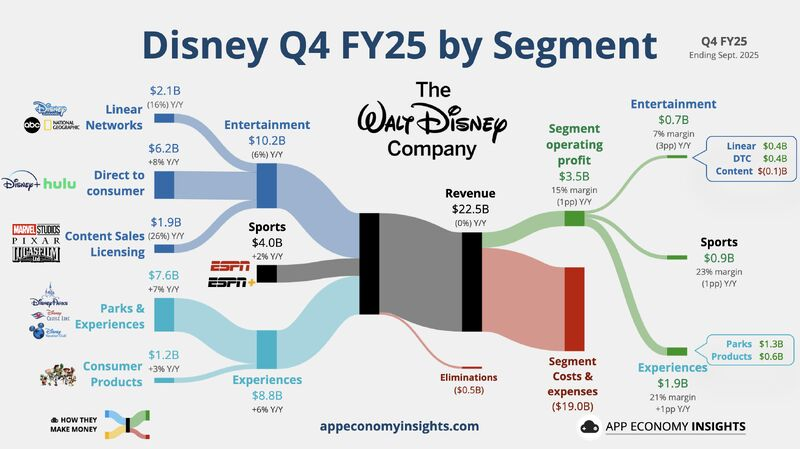
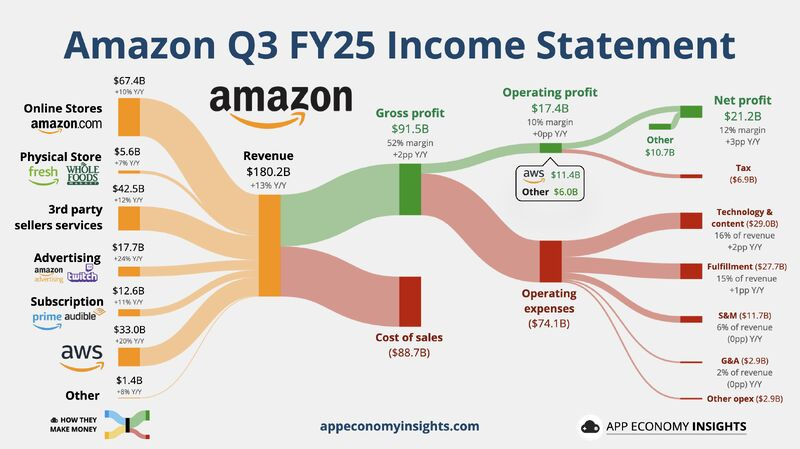
Similarly, a few more examples for references –

Images credit: App Economy Insights

Sankey diagrams don’t just visualize data – they reveal truth through flow.

They help organizations move from:

  • Static reporting → dynamic understanding
  • Siloed metrics → system-level thinking
  • “What happened?” → “Where should we intervene?”

In a world drowning in dashboards, the Sankey diagram remains one of the most honest ways to show how value actually moves through a business.

AI Generalist vs Specialist: Who Wins in the Age of AI?

The world of work is undergoing a profound transformation. For decades, the traditional wisdom was clear: specialists build deep expertise, and generalists provide broad context.

Specialists earned higher pay, commanded niche roles, and organizations organized work around clearly defined roles. But as AI reshapes how knowledge is created, applied, and scaled, that old model is being challenged.

In today’s AI-driven landscape, versatility and adaptability increasingly matter as much as deep technical depth. The million-dollar question is:

In the AI era, which matters more – deep specialization or broad generalization?
And more importantly, how should individuals and organizations think about skills, roles, and hiring?

From Slow Change to Rapid Reinvention

Before AI became mainstream, technology evolved slowly.

Specialists such as system architects, database experts, front-end developers could build deep domain knowledge and rely on that expertise to drive predictable outcomes. A Java expert in 2010 could reliably deliver high-performance backend systems because the technology stack was stable for years.

But AI fundamentally changed that dynamic.

AI technologies evolve in months, not years. New models emerge every quarter. Tools that automate deep learning pipelines, conjure production-ready code, or help design user workflows now exist – often before anyone is an expert in using them.

This rapid pace means that specialists rarely get the luxury of working in stable environments for long. The problems of today require fluidity to learn, unlearn, re-learn, and integrate multiple domains.

Why AI Favors Generalists

A recent VentureBeat article argues that the age of the pure specialist is waning and that generalists with range, adaptability, and decision-making can thrive in AI environments.

The key reasons cited:

🔹 Speed of Change

New technologies and frameworks emerge so quickly that specialists built for one stable stack struggle to stay current.

🔹 Breadth Over Depth

Problem-solvers who understand multiple layers from product design to data infrastructure to user experience are better equipped to leverage AI tools for real business outcomes.

🔹 End-to-End Ownership

Generalists often take accountability for outcomes, not just tasks, enabling faster decisions with imperfect information – a hallmark of modern AI work.

In essence, the article suggests that AI compresses the cost of knowledge, making it easier for generalists to perform tasks that once demanded highly specialized training. At the same time, it creates a premium on learning agility, adaptability, and cross-functional thinking.

What Makes a Strong Generalist in the AI Era?

Drawing from synthesis across industry thought:

Breadth with Depth: Not shallow breadth, but deep fluency in a couple of domains plus competence in many.
Curiosity & Adaptability: The ability to quickly learn new technologies and integrate them into solutions.
Agency & Ownership: Acting decisively even with incomplete information.
Cross-Disciplinary Thinking: Connecting dots across engineering, business, design, and operations.

Generalists excel not because they know everything, but because they can connect everything.

But Specialists Still Matter – Especially in High-Stakes Domains

While the pendulum may be swinging, specialization still has critical value particularly where precision, domain depth, and contextual understanding are paramount.

In technical domains like:

  • Medical AI and imaging
  • Financial risk and regulatory compliance
  • Security, safety, and ethical AI engineering

specialists often outperform generalists because their deep expertise enables them to make fine-grained judgments and avoid catastrophic errors that a broad but shallow understanding might overlook.

Specialists are also harder to replace with AI alone because many complex domain problems require years of tacit knowledge, situational judgment, and context that AI hasn’t mastered.

AI Isn’t Killing Specialists – It’s Expanding Roles

AI lowers the barrier for execution and routine tasks, but it raises the bar for judgment and context. This means:

🔸 Specialists can now leverage AI as a force multiplier – AI handles repetitive and foundational work, while specialists focus on nuance and innovation.
🔸 Generalists can apply AI tools to bridge gaps between domains and lead cross-functional initiatives.
🔸 The true winners are often T-shaped professionals – those with one or two deep competencies and a broad understanding across related areas.

The Balanced Reality: Not Generalists vs Specialists – But How They Work Together

While some voices suggest generalists are the clear winners, the actual landscape is more nuanced.

AI enables:

  • Generalists to do more with less (launch prototypes, explore new areas, coordinate teams).
  • Specialists to focus on high-value, high-impact tasks that AI cannot fully solve.

The most successful organizations adopt a hybrid talent model:

  • Use specialists for deep technical work
  • Use generalists to integrate, orchestrate, and guide business impact

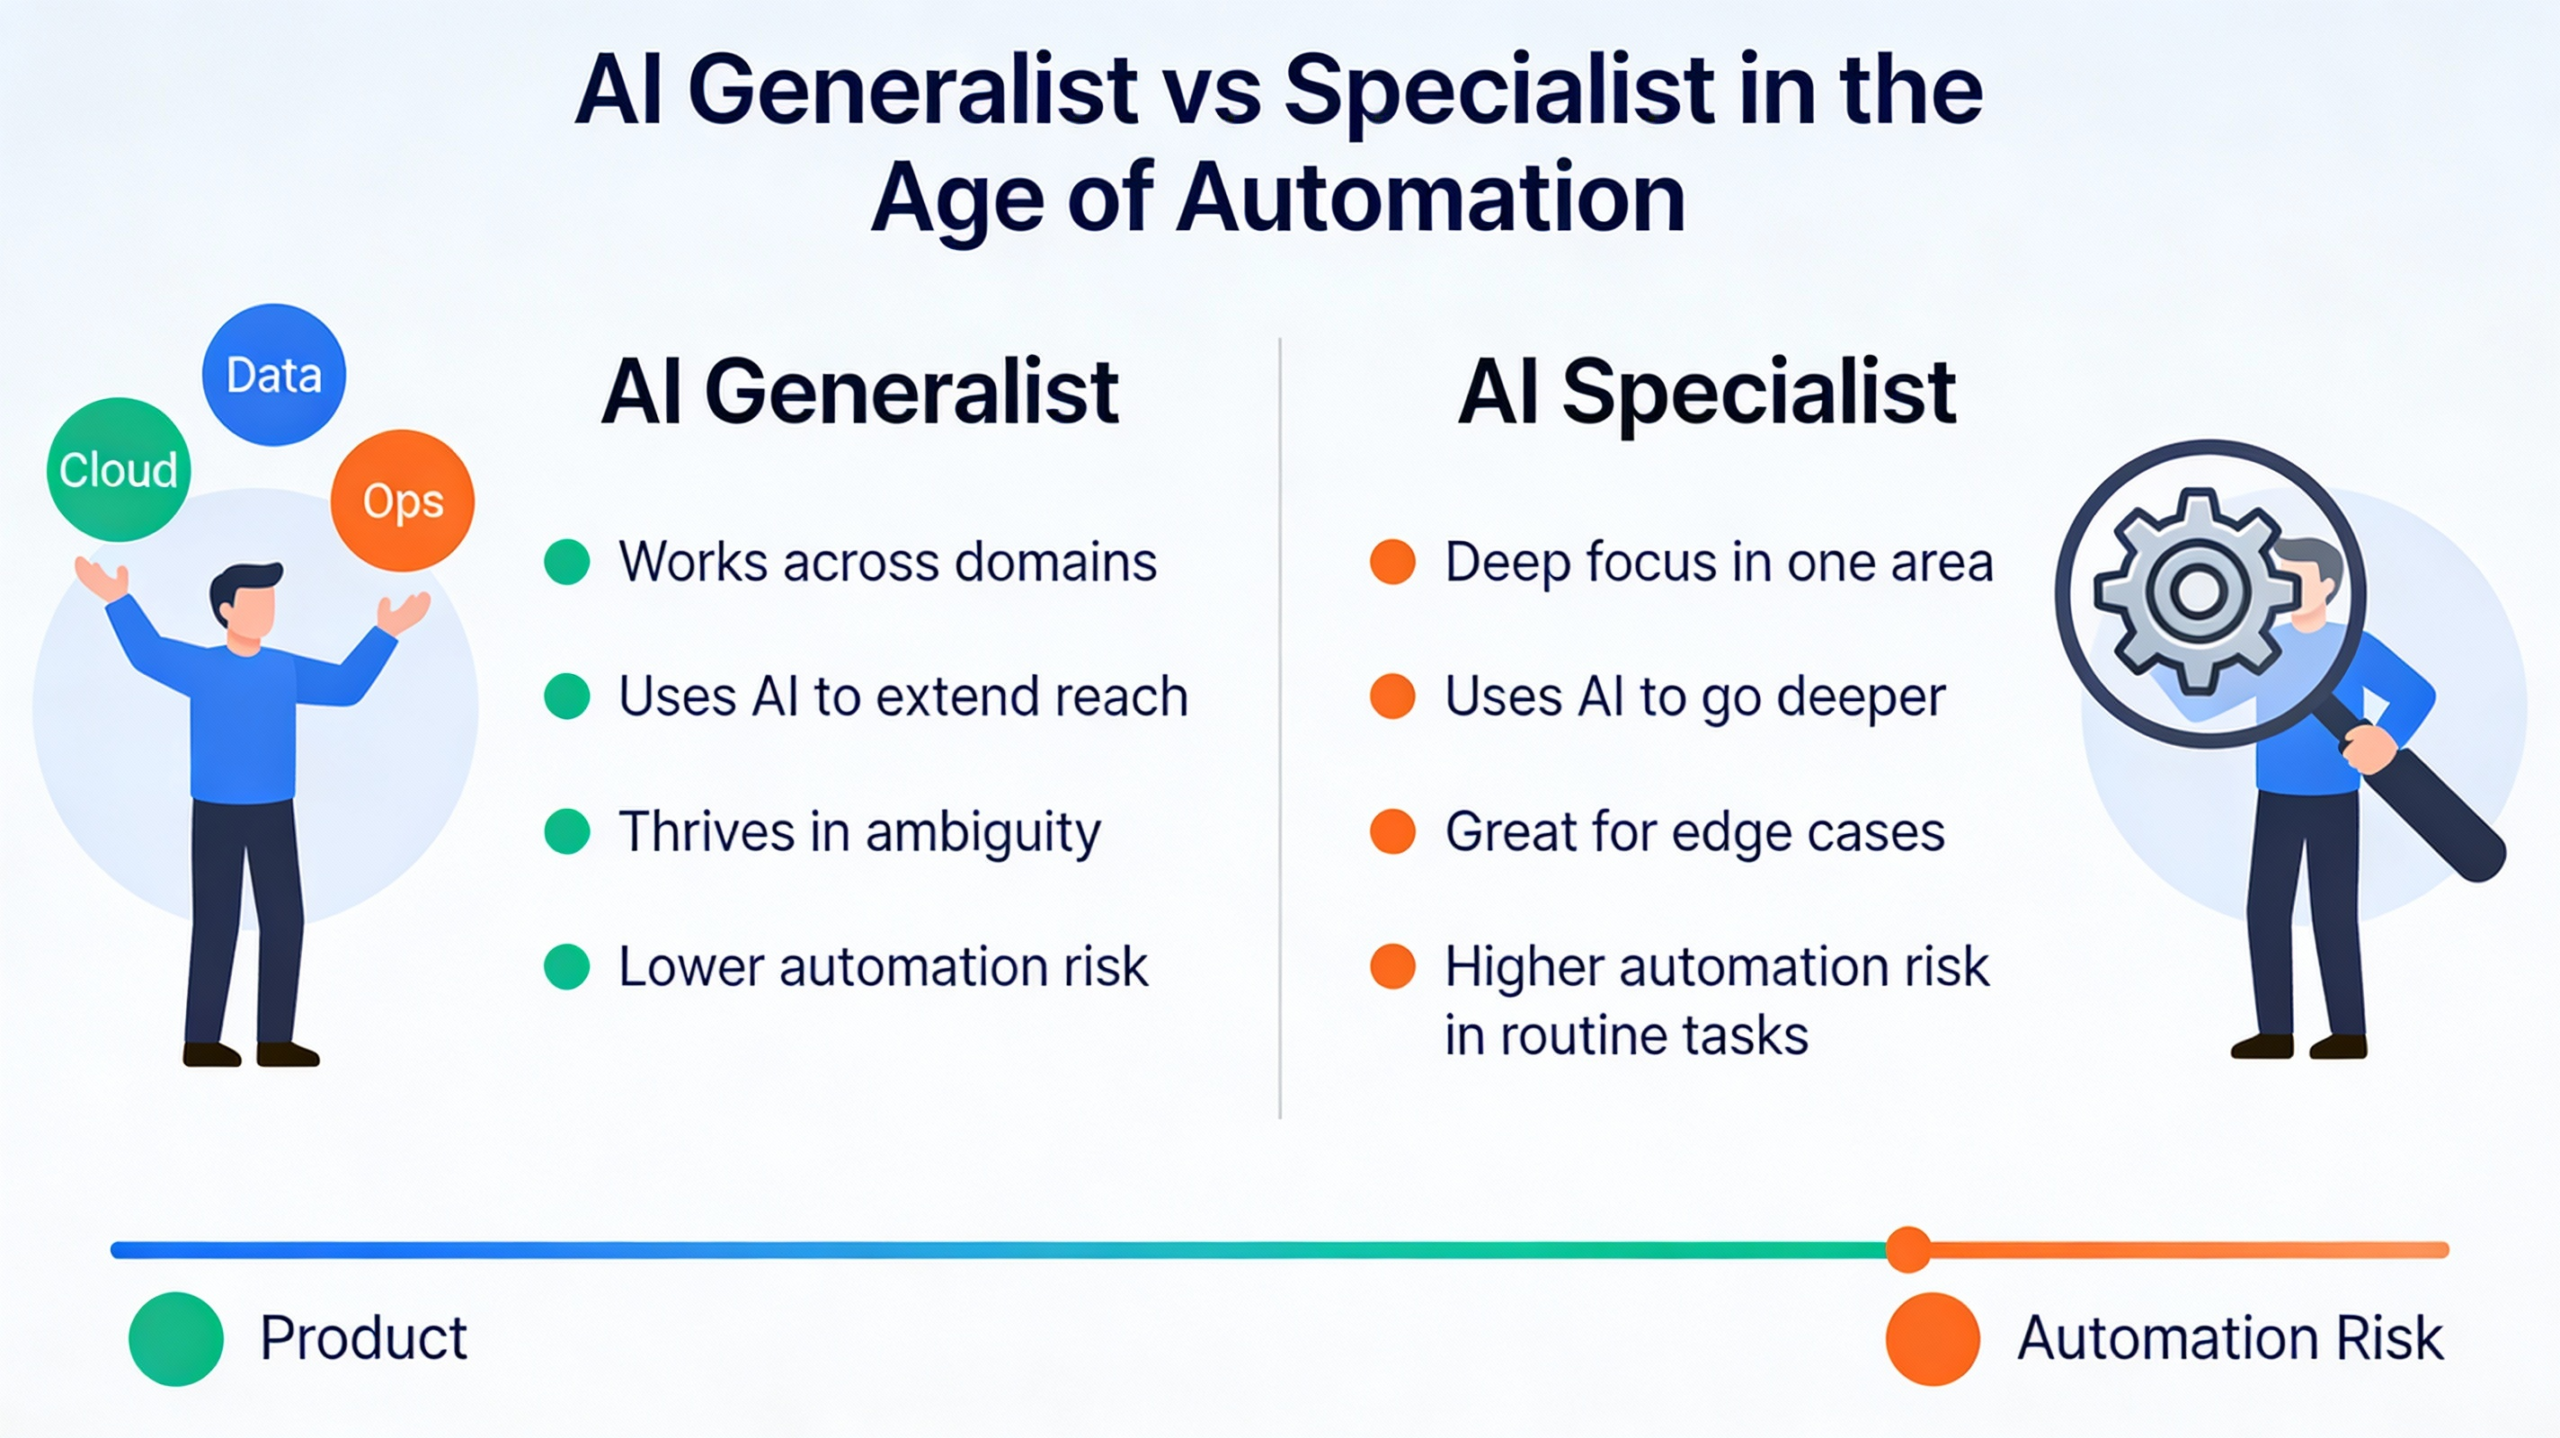
A useful way to view this is: AI is making “T-shaped” and “polymath” talent structurally more valuable.

DimensionAI Generalist (T‑shaped / polymath)AI Specialist (deep domain expert)
Scope of workWorks across multiple domains (ML, Product, Ops, UX), stitches end-to-end solutions.Focuses on a narrow technical or domain slice, e.g., model optimization or infra scaling.
Core advantageContext switching, problem framing, integration, and using AI tools to move fast.Depth of insight, quality at the frontier, and solving hard edge cases.
Relationship to AIUses AI to extend reach across functions; or AI polymath.Uses AI to go deeper in a niche (e.g., better architectures, experiments, proofs).
Risk from automationLower: work involves ambiguity, coordination, and judgment across systems.Higher in routine, narrow tasks that AI can now codify and automate.
Typical rolesProduct‑minded engineers, founding team members, solution architects, AI strategists.Research scientists, core ML engineers, safety & reliability experts, domain‑heavy analysts.
Where they shineEarly‑stage products, zero‑to‑one initiatives, cross-functional transformations.Late‑stage optimization, regulated domains, and frontier R&D.

AI doesn’t make specialist knowledge obsolete – it makes specialist knowledge more productive, and generalist judgement more valuable.

Agentic AI Revolution: From Data-Driven Decisions to Fully Autonomous Enterprises

For more than a decade, organizations have invested heavily in AI – collecting data, building models, and deploying dashboards. Yet despite massive AI adoption, a fundamental gap remains:

AI still waits for humans to act.

The next wave of AI doesn’t just analyze, predict, or generate.
It plans, decides, executes, and optimizes end to end.

This is the rise of Agentic AI.

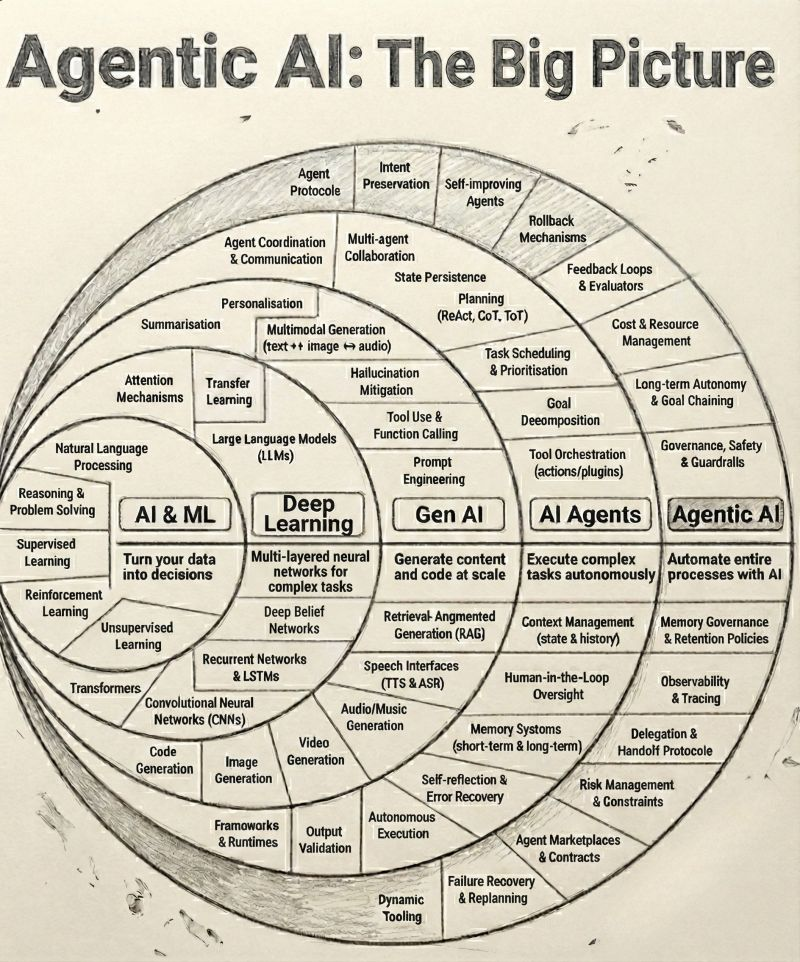
The Evolution of AI: A Clear Progression

To understand why Agentic AI is transformative, we must view it as a natural evolution, not a sudden breakthrough.

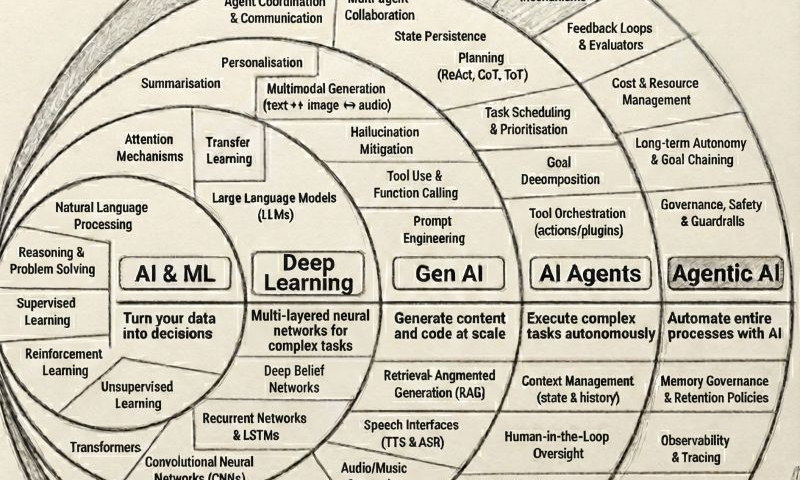
1. AI & ML: Turning Data into Decisions

This is where most enterprises began.

  • Predict churn
  • Forecast demand
  • Optimize pricing
  • Detect fraud

Outcome:
Models generate insights → humans take actions.

AI answered “What should we do?”
Humans answered “Okay, now let’s do it.”

2. Deep Learning: Handling Complexity at Scale

Deep learning pushed AI beyond rules and feature engineering.

  • Image recognition
  • Speech-to-text
  • Recommendation engines
  • Natural language understanding

Outcome:
AI handled high-dimensional, unstructured data but still stopped short of execution.

3. Generative AI: Creating Content and Code

Generative AI unlocked unprecedented productivity.

  • Write content
  • Generate code
  • Summarize documents
  • Assist with reasoning

Outcome:
AI became a co-pilot, accelerating human workflows.

GenAI says: “Here’s the content/code.”
Humans still say: “I’ll decide what to do next.”

4. AI Agents: Executing Multi-Step Tasks

AI Agents introduced goal-oriented behavior.

An AI agent can:

  • Break a task into steps
  • Call tools and APIs
  • Observe outcomes
  • Adjust actions dynamically

Example:
A marketing agent that:

  • Analyzes campaign performance
  • Adjusts budget
  • Launches experiments
  • Reports results

Outcome:
AI started acting, not just assisting but usually within narrow tasks.

5. Agentic AI: Automating Entire Processes

This is where the real shift happens.

Agentic AI is not a single agent.
It is a system of coordinated AI agents that can:

  • Understand business goals
  • Design execution plans
  • Orchestrate multiple tools, models, and workflows
  • Learn from outcomes
  • Continuously optimize without human intervention

Agentic AI doesn’t ask “What should I generate?”
It asks “What outcome am I responsible for?”

Image credit: https://www.linkedin.com/in/brijpandeyji/

What Makes Agentic AI Fundamentally Different?

CapabilityTraditional AIGenAIAgentic AI
Insights
Content Generation
Tool UsageLimited
Multi-step Planning
Autonomous Execution
Outcome Ownership

Agentic AI owns the full loop:
Goal → Plan → Act → Observe → Improve

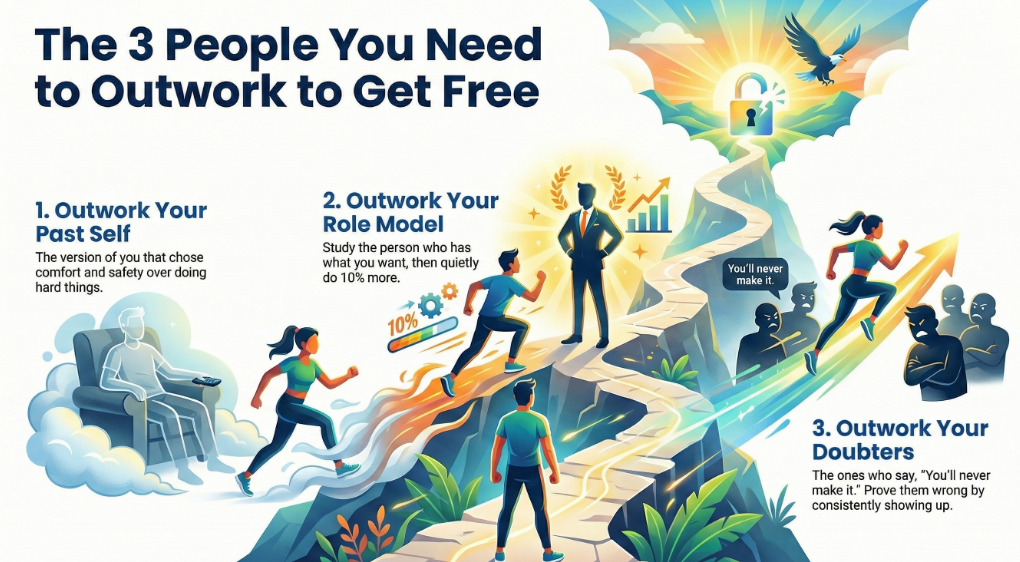
Many people believe that to achieve massive success, they must outwork the entire world.

However, you don’t actually need to beat billions of people; you only need to outwork three specific individuals to get ahead of life, to get rich and, more importantly, to get free.

1. The “Past You”

The “Past You” is the version of yourself that prioritized comfort and safety over success. This is the person who looked at a difficult task and decided to do it “later” or stayed in bed because it was warm.

Real-World Example: Imagine a budding entrepreneur who, for months, avoided the “hard thing” – like cold-calling potential clients or waking up at 5:00 AM to work on their business plan before their day job. To win, they must outwork that past version of themselves by doing those exact difficult tasks today that they put off yesterday.

2. The Person Who Already Has What You Want

Instead of falling into the trap of envy, you should study those who have already achieved your goals. Observe how they think, what they sacrificed to get there, and how they execute their daily tasks.

Real-World Example: If you are a salesperson aiming to be the top earner in your firm, don’t just watch the current leader with jealousy. Study their routine and then quietly do 10% more. If they make 50 calls a day, you make 55. If they stay until 6:00 PM, you stay until 6:30 PM. Doing one more call, one more rep, or one more late night is the key to eventually surpassing them.

3. The Person Counting on You to Quit

There will always be skeptics – the people who tell you that your idea is “too risky” or that you “aren’t built for this”. You don’t need to waste your energy arguing with them or trying to prove them wrong with words.

Real-World Example: Think of an athlete whose peers say they’ll never make the varsity team. The athlete doesn’t need to explain their talent; they simply need to keep showing up to every practice and putting in the work until their results become so undeniable that they can no longer be ignored.

The Path to Freedom

If you focus on outworking these three people long enough, you won’t just find get ahead of all those 99% people, you will achieve true freedom.

Success in this journey is like building a stone wall. You aren’t trying to build the whole wall in a day; you are simply focused on laying the next brick better than you did yesterday (outworking “Past You”), laying one more brick than the master mason next to you (outworking the person who has what you want), and continuing to lay bricks even when people say the wall will fall (outworking those counting on you to quit). Eventually, you have a fortress that no one can take away from you.

How to be the Top 1% Learner?

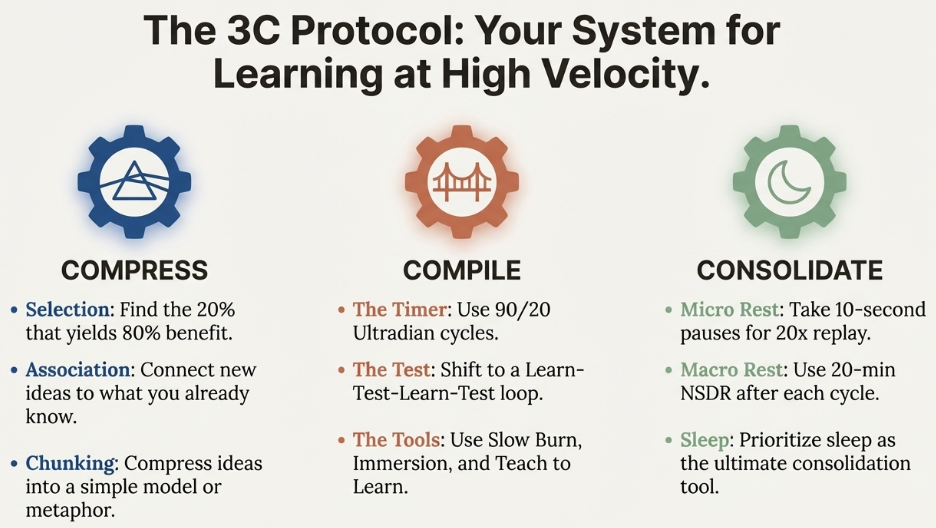
In an age where AI makes intelligence a commodity, your only real competitive edge is how fast you can learn and stay ahead. Most people fail because they try to “jam and cram” information into their prefrontal cortex, which acts like a “tiny cognitive bowl” that can only hold about four independent ideas at once.

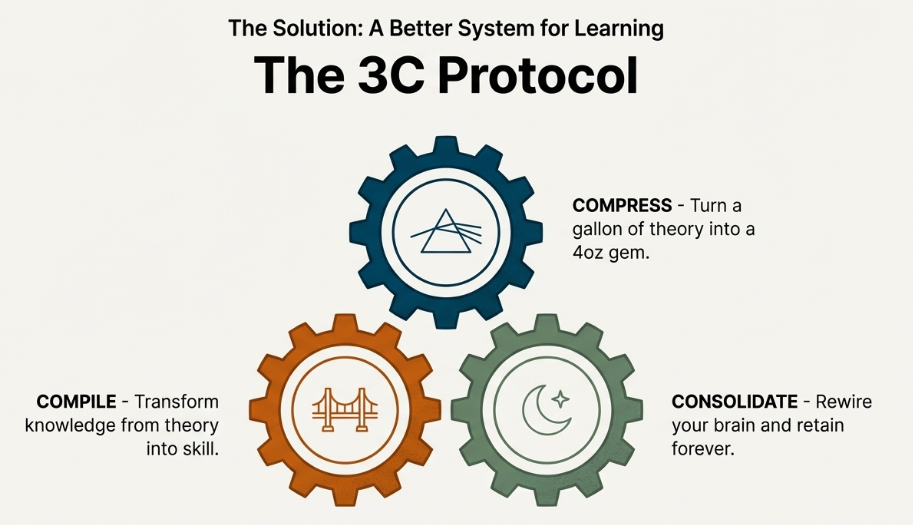
To break into the top 1% of learners, you must stop hoarding information and start using the 3C Protocol: Compress, Compile, and Consolidate.

1. Compress: Turn Data into Patterns

The first step is reducing complex theories into small, manageable chunks that your brain can actually carry.

An Example (Chess): Grandmaster Magnus Carlson doesn’t memorize every possible move; instead, he has internalized up to 100,000 patterns. He wins by associating a new move on the board with an old pattern he already understands.

Actionable Tip: When reading a book, don’t read every page. Apply the 80/20 rule by selecting the 20% of chapters that provide 80% of the value. Connect these new ideas to something you already know and turn them into a simple drawing or metaphor.

2. Compile: Move from Consumption to Action

Mastery is not about what you can recall, but what you can do. The tragic story of savant Kim Peak – who could recall 12,000 books but struggled with basic daily chores – proves that memory alone is not mastery.

An Example (The Musician): If you are learning a physical skill like the guitar, use the “Slow Burn” tool. Play at an excruciatingly slow pace while maintaining intense focus on every micro-move. This ensures the brain is actively “compiling” the skill rather than operating on autopilot.

Actionable Tip: Use 90-minute “ultradian” focus blocks. Instead of waiting months for a final exam, create “agile” learning loops: learn, test, learn, test. You can even “teach to learn” by lecturing to a wall as if you were giving a TED talk to internalize the material.

3. Consolidate: Honor the Rest

Retention doesn’t happen while you are studying; it happens when you stop. Learning is a two-stage process where focus sends the “rewire” request, but rest is where the actual wiring occurs.

An Example (Farmer): Just as a farmer knows a field must rest to regain its fertility, a learner must manage rest at micro and macro levels.

Actionable Tip: Within your 90-minute work block, take 10-second micro-breaks. Research shows that during these pauses, your brain replays what you just learned at 10 to 20 times the speed, giving you “free reps” of practice. After your session, practice NSDR (non-sleep deep rest) or Yoga for 20 minutes to let your brain connect information without distractions.

The Mindset Shift

To succeed with the 3C Protocol, you must stop racing others and focus only on beating who you were yesterday. When you are in the middle of a learning session, be the performer, not the critic. If you feel friction, don’t quit – that struggle is the “generation effect” signaling that deep wiring is taking place.

Shift-Left, Shift-Right: The Twin Strategies Powering Modern IT and Data Operations

In today’s always-on digital enterprises, downtime and performance issues come at a steep cost. The modern DevOps philosophy has redefined how organizations build, test, deploy, and manage software and data systems. Two terms: Shift-Left and Shift-Right capture this evolution perfectly.

These approaches are not just technical buzzwords; they represent a cultural and operational transformation from reactive troubleshooting to proactive prevention and continuous improvement.

1. What Does “Shift-Left” Mean?

Shift-Left” is all about moving quality and risk management earlier in the lifecycle, to the “left” of the traditional project timeline.

Historically, teams tested applications or validated data after development. By that stage, identifying and fixing issues became expensive and time-consuming.
Shift-Left reverses that by embedding testing, data validation, and quality assurance right from design and development.

Real-world example:

  • Microsoft uses Shift-Left practices by integrating automated unit tests and code analysis in its continuous integration (CI) pipeline. Each new feature or update is tested within minutes of being committed, drastically reducing post-release defects.
  • In a data engineering context, companies like Databricks and Snowflake promote Shift-Left Data Quality – validating schema, freshness, and business rules within the pipeline itself before data lands in analytics or AI systems.

Why it matters:

  • Reduces defects and rework
  • Improves developer productivity
  • Speeds up deployment cycles
  • Builds confidence in production releases

2. What Does “Shift-Right” Mean?

Shift-Right” extends testing and validation after deployment, to the “right” of the timeline. It’s about ensuring systems continue to perform and evolve once they’re live in production.

Rather than assuming everything works perfectly after release, Shift-Right emphasizes continuous feedback, monitoring, and learning from real user behavior.

Real-world example:

  • Netflix uses Shift-Right principles through its famous Chaos Engineering practice. By intentionally disrupting production systems (e.g., shutting down random servers), it tests the resilience of its streaming platform in real-world conditions.
  • Airbnb runs canary deployments and A/B tests to validate new features with a subset of users in production before a global rollout – ensuring a smooth and data-driven experience.

Why it matters:

  • Improves reliability and resilience
  • Enables real-time performance optimization
  • Drives continuous learning from production data
  • Enhances customer experience through fast iteration

3. When Shift-Left Meets Shift-Right

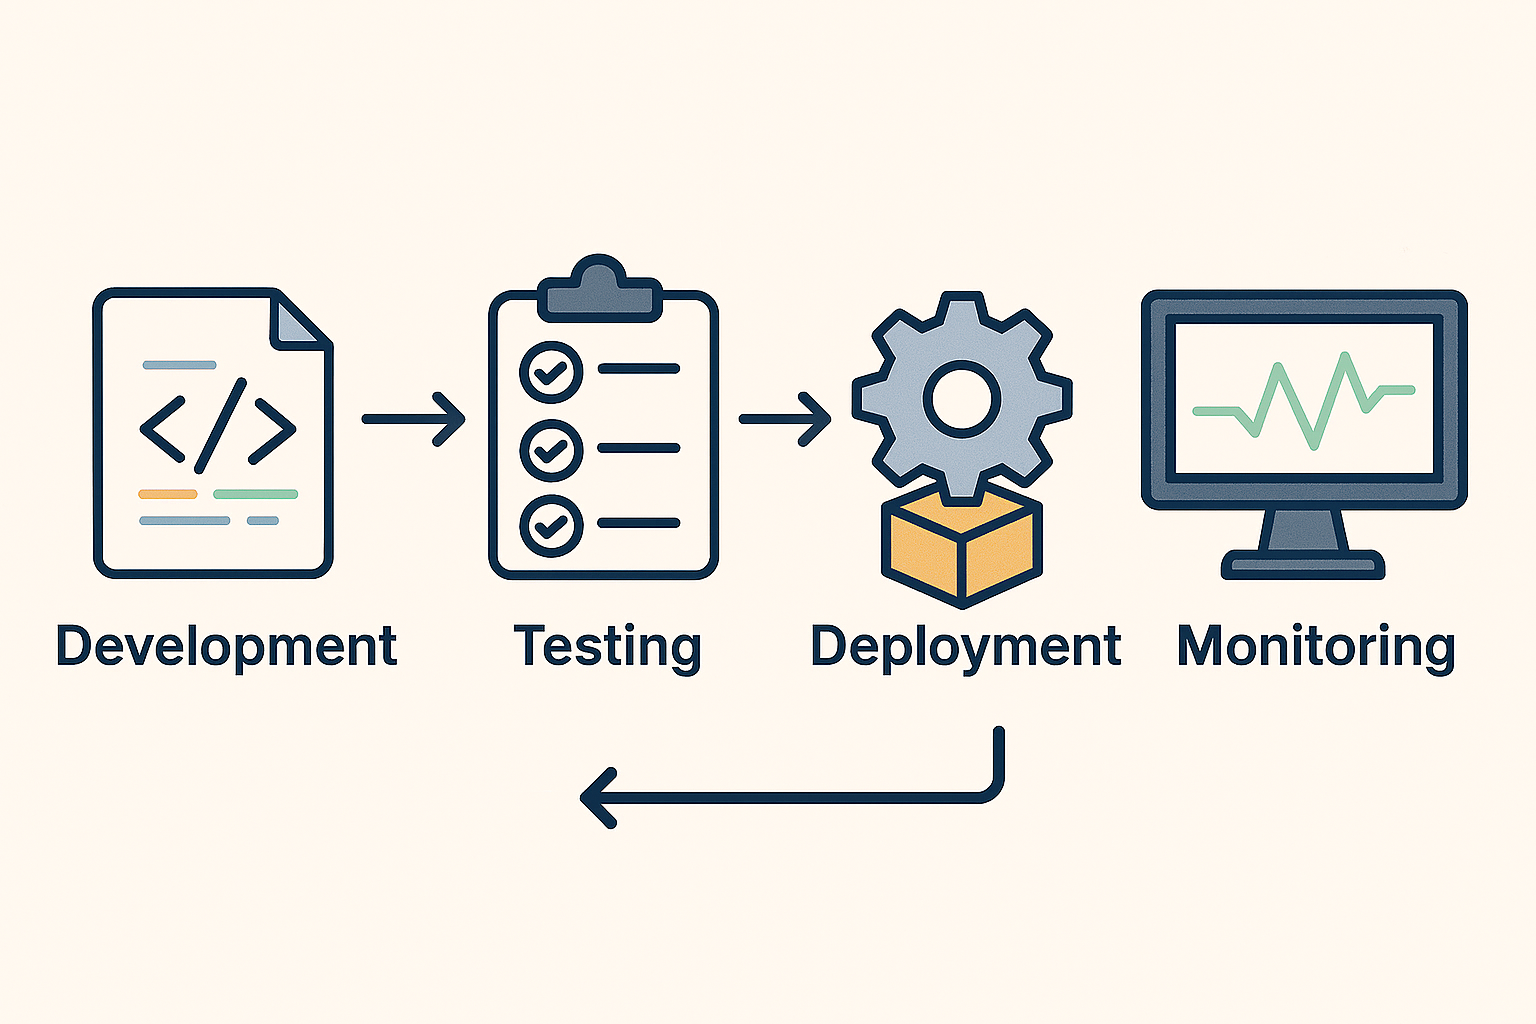
In modern enterprises, Shift-Left and Shift-Right are not opposites – they’re complementary halves of a continuous delivery loop.

  • Shift-Left ensures things are built right.
  • Shift-Right ensures they continue to run right.

Together, they create a closed feedback system where insights from production feedback into design and development creating a self-improving operational model.

Example synergy:

  • A global retailer might Shift-Left by embedding automated regression tests in its data pipelines.
  • It then Shifts-Right by using AI-based anomaly detection in production dashboards to monitor data drift, freshness, and latency.
  • Insights from production failures are looped back into early validation scripts closing the quality loop.

4. The AI & Automation Angle

Today, AI and AIOps (AI for IT Operations) are supercharging both shifts:

  • Shift-Left AI: Predictive code scanning, intelligent test generation, and synthetic data generation.
  • Shift-Right AI: Real-time anomaly detection, predictive incident management, and self-healing automation.

The result? Enterprises move from manual monitoring to autonomous operations, freeing up teams to focus on innovation instead of firefighting.

The future of enterprise IT and data operations isn’t about reacting to problems – it’s about preventing and learning from them continuously.
“Shift-Left” ensures quality is baked in early; “Shift-Right” ensures reliability is sustained over time.

Together, they represent the heart of a modern DevOps and DataOps culture — a loop of prevention, observation, and evolution.

Canary Deployment Explained: Reducing Production Risk in DevOps with Controlled Releases

Canary deployment is one of those DevOps terms that sounds abstract but is actually a very clever, real-world technique used by top tech companies like Netflix, Amazon, and Google.

Let’s unpack it in a clear, practical way –

What Is a Canary Deployment?

A canary deployment is a progressive rollout strategy where a new version of an application (or data pipeline, model, etc.) is released to a small subset of users or systems first, before deploying it to everyone.

The goal: Test in the real world, minimize risk, and catch issues early – without impacting all users.

Where the Name Comes From

The term comes from the old “canary in a coal mine” practice.

  • Miners used to carry a canary bird underground.
  • If dangerous gases were present, the bird would show distress first – warning miners before it was too late.

Similarly, in software deployment:

  • The “canary group” gets the new version first.
  • If problems occur (e.g., errors, latency spikes, or crashes), the rollout stops or rolls back.
  • If all looks good, the new version gradually reaches 100% of users.

How It Works in Practice

Here’s the step-by-step flow:

  1. Deploy new version (v2) to a small portion of traffic (say 5-10%).
  2. Monitor key metrics: performance, error rates, user engagement, latency, etc.
  3. Compare results between the canary version and the stable version (v1).
  4. If KPIs are healthy, automatically scale up rollout (20%, 50%, 100%).
  5. If issues arise, rollback instantly to the previous version.

Example Scenarios

1) Web / App Deployment

A global streaming platform like Netflix releases a new recommendation algorithm:

  • First, 5% of users in Canada get the new algorithm.
  • Netflix monitors playback time, user retention, and error logs.
  • If everything looks good, it expands to North America, then globally.

2) Data Pipeline or Analytics System

A retailer introduces a new real-time data ingestion flow:

  • It runs in parallel with the old batch flow for one region (the canary).
  • Teams compare data accuracy, latency, and system load.
  • After validation, the new pipeline fully replaces the old one.

Benefits

BenefitDescription
Reduced RiskProblems affect only a small user group initially
Faster FeedbackReal-world validation of performance & stability
Controlled RolloutGradual scaling based on metrics
Easy RollbackQuick reversion to the stable version if issues occur

Challenges

  • Requires strong observability and real-time monitoring tools (like Datadog, Prometheus, or Azure Monitor).
  • Needs automated rollback scripts and infrastructure-as-code setup.
  • Works best in containerized environments (Kubernetes, Docker, etc.) for version control and isolation.

In Summary

Canary deployment = “Release small, observe fast, scale safely.”

It’s a smart middle ground between risky full releases and overly cautious manual rollouts – ensuring continuous innovation with minimal disruption.