When Bad Data Becomes the Real Enemy: Data Quality Issues That Can Sink Enterprise AI Projects
Enterprise organizations are investing billions in AI, analytics, and automation. But despite advanced AI models, cloud platforms, and state-of-the-art analytics tools, most companies still struggle with one fundamental issue:
Bad data – not bad models – is the #1 reason AI and analytics initiatives fail.
In fact, mislabeled, inconsistent, siloed, or incomplete data can derail projects long before they reach production. Understanding and fixing data quality issues isn’t a side project – it’s the foundation of responsible, reliable, and repeatable AI.
Why Data Quality Matters More Than You Think
You might assume that data problems are just “technical nuisances.” In reality, poor data quality:
- Skews analytics outputs
- Produces biased AI models
- Wastes resources in retraining and debugging
- Creates governance, compliance, and operational risks
- Slows or blocks AI adoption entirely – up to 77% of organizations report data quality issues blocking enterprise AI deployments.
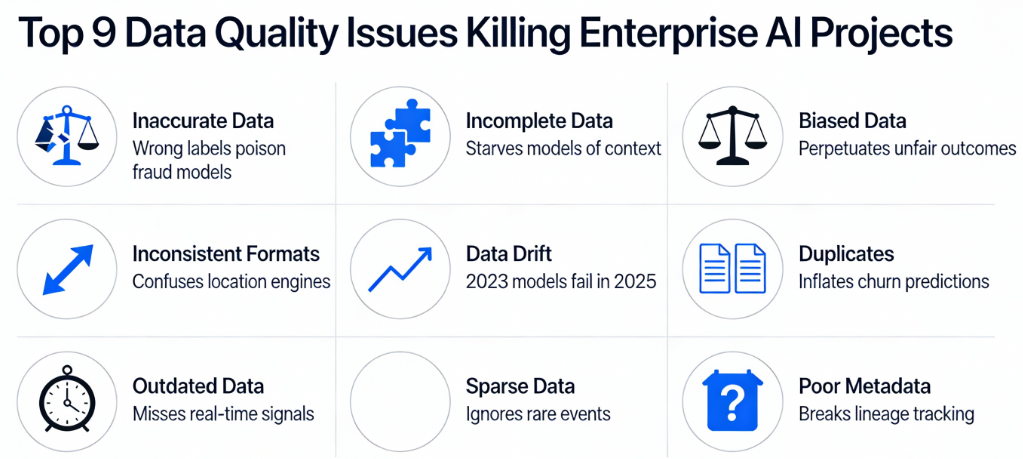
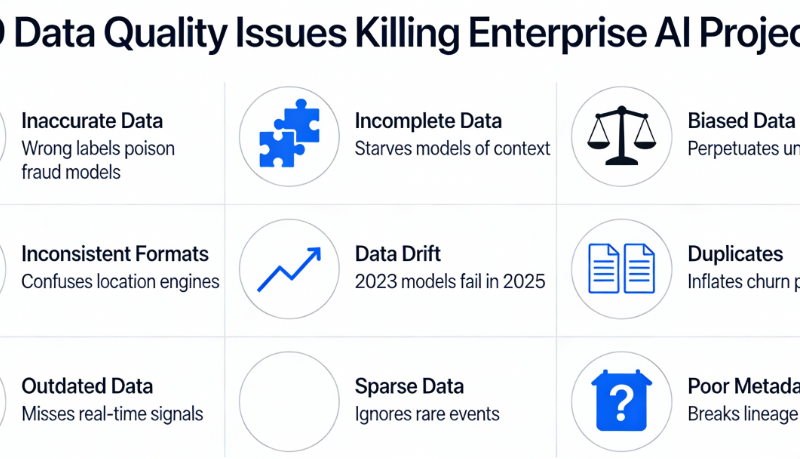
The 9 Most Common Data Quality Issues
These issues are drawn from industry research and practitioner experience and they show why even the most ambitious AI initiatives can go off the rails.
1. Inaccurate, Incomplete, or Improperly Labeled Data
Problem: Models trained on incorrect or missing values will produce flawed outputs – sometimes in subtle and dangerous ways.
Example:
A retail company rolling out demand forecasting found its AI model consistently overestimated sales. The reason? Product attributes were inconsistent across channels, and key stock-keeping units (SKUs) were missing price history. The result: overproduction and increased inventory write-offs.
Lesson:
Before modeling, data must be validated for truthfulness and completeness and not just quantity.
2. Too Much Data (Noise Overload)
Problem: More data isn’t always better. Large datasets may include irrelevant or noisy data that confuses learning algorithms rather than helping them.
Example:
A global bank collected customer transaction data from multiple geographies but failed to filter inconsistencies. Instead of improving credit risk predictions, the model learned patterns from inconsistent labeling standards in different regions, reducing its accuracy.
Lesson:
Curate, filter, and focus your datasets – bigger isn’t always better.
3. Too Little or Unrepresentative Data
Problem: Small or narrow datasets result in models that fail to generalize to real-world scenarios.
Example:
A healthcare analytics initiative to detect rare diseases had plenty of records for common conditions, but only a handful for the target condition. The model overfit to the common classes and failed to detect real cases.
Lesson:
Ensure your training data is representative of the full problem space.
4. Biased & Unbalanced Data
Problem: Models trained on skewed samples inherit bias, leading to unfair or incorrect outputs.
Example:
A hiring tool was trained on historical candidate data which reflected past hiring biases. The AI began to replicate those biases, ranking similar candidates unfairly.
Lesson:
Detect and correct bias early through sampling and fairness audits.
5. Data Silos Across the Organization
Problem: When teams or departments hoard data in separate systems, models lack a unified view of the enterprise context.
Example:
A global insurer with separate regional databases struggled to build a unified AI model. Customer risk profiles differed simply because regional teams measured metrics differently. The result? Inconsistent underwriting decisions and regulatory alarms.
Lesson:
Break silos with enterprise-wide data standardization and governance.
6. Inconsistent Data Across Systems
Problem: Same entities may be represented differently across systems causing mismatches that cascade into analytics errors.
Example:
A multinational consumer packaged goods company found that customer identifiers were inconsistent between CRM, ERP, and sales systems. The result was flawed customer segmentation and misdirected marketing spend.
Lesson:
Establish universal identifiers and shared data dictionaries.
7. Data Sparsity (Missing Values)
Problem: Data sparsity arises when expected values are missing – a common challenge in big enterprise datasets.
Example:
A predictive maintenance model for industrial equipment failed because many sensor values were sporadically missing leading to unreliable predictions and frequent false alarms.
Lesson:
Invest in data completeness checks and fallback imputations.
8. Labeling Issues
Problem: Training data must be correctly tagged or annotated; otherwise, models learn the wrong signals.
Example:
In an AI customer sentiment project, product reviews were labeled incorrectly due to inconsistent annotation standards leading the model to misclassify sentiments by a significant margin.
Lesson:
Rigorous labeling protocols and consensus among annotators improve model reliability.
9. “Too Fast, Too Loose” Integration of Synthetic or Noisy Data
Problem: Using synthetic data without proper controls can amplify noise and bias in models.
Example:
An enterprise used auto-generated customer profiles to augment scarce training data. Instead of improving performance, the model learned artificial patterns that didn’t exist in real behavior reducing real-world accuracy.
Lesson:
Balance synthetic data with real, high‐fidelity datasets.
Enterprise Impact: It’s Not Just About Models; It’s About Business Outcomes
Poor data quality isn’t just a data team problem – it has real business costs and strategic implications:
Financial Losses and Failed Projects
- Organizations with poor data quality spend millions each year remediating data and fixing failed AI initiatives.
Competitive Disadvantage
Teams with reliable, governed data outperform competitors by:
- Faster AI deployments
- Better customer insights
- Higher operational efficiency
Regulatory and Compliance Risks
In industries like finance and healthcare, data quality issues can lead to misreporting and legal penalties.
Best Practices to Mitigate Data Quality Risks
- Early Profiling and Quality Checks
Start with data profiling before modeling begins. - Centralized Governance
Break silos with strong governance, shared definitions, and quality standards. - Automated Validation in Pipelines
Use validation tools and anomaly detection in ETL pipelines. - Bias and Fairness Audits
Regularly test models for skew and bias. - Continuous Monitoring Post-Deployment
Data drift can make even previously high-quality data degrade over time – monitor and retrain as necessary.
Data Quality Is Business Quality
Investments in AI and analytics are only as effective as the data that feeds them. High-quality data enhances trust, scalability, and business outcomes. Poor quality data, on the other hand, drains resources, undermines confidence, and derails innovation.
In the modern enterprise, data quality isn’t a technical challenge – it’s a strategic imperative.


