I’ve been working on various Software Development Life Cycles such as Waterfall, Agile Scrum.
In a typical software project, I see there are 6 steps involved:
1) Requirements elicitation (gathering),
2) Designing,
3) Implementation,
4) Testing,
5) Deployment and
6) Maintenance (Support)
These best practices enable us to be focused on the deliverable and keep a tab on the timeline. The same thought process can be applied for any analytics projects as well. This article gives you a perspective on the steps involved in the analytics projects.
Let’s take a simple example to go over the steps in detail.
This example is created for illustration purpose.
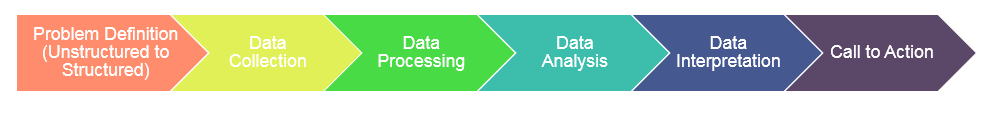
Step 1) Unstructured to Structured Problem Statement
The Government of a country wants to cut off the intermediaries while distributing the benefits to the poor people. The pain point for the Government is that, its beneficiary schemes are not reaching to the poor people to a great accuracy and degree. And they want to tackle this problem with a better approach.
For this purpose, we can take up the Below Poverty Line (BPL) to measure the poverty of a family. On the international standard, if a family lives with the daily wage of say $1.90, then the family would be categorized to be living under the BPL. To validate if such an experiment would be useful, the committee is thinking to set this up as a pilot project for an identified district of a state.
The aim of this project is to identify 5,000 BPL families in the district and offer them each a smart card. The Government might use the card to transact some amount directly to the beneficiaries eliminating the middle men on a monthly/quarterly basis.
Step 2) Data Collection
This is a very challenging step of the project. Remember, “garbage in, garbage out”? If the quality of your data is bad, then the model or outcome of what you’re intending to bring out would be erroneous. 60% to 70% of the time invested in analytics projects could be utilized during this stage!
The data can be external or internal, in general. Assume that the Government do not have any census data which captured the monthly income of the family to determine if they belong to BPL or not.
In this case, a survey should be rolled out comprising of simple questions and get the answers from each family.
What kind of questions to be asked to each family?
If you too think about asking a direct monthly income based question, then think twice. I had exactly the same viewpoint. However, it won’t work because either the family might underestimate its income or they don’t have the standard daily wages coming in.
Thus, the questions to be framed should somehow cover the income type without even directly touching upon it. Some of the parameters to be considered are: Family size, head of the family (M/F), access to clean water, sanitation, land & house (own/rent), vehicle, education, skill-sets, occupation, weekly or monthly expenses on staple food items etc.
At the end of this exercise, you would have framed the questions. Think of it as a model and assign the score (weight) to each parameter. Using the accumulated score, a family can be determined if BPL or not.
Step 3) Data Processing
The agents who ask questions and capture data on behalf of the Government or the analytics consultant should be educated. At times, the data would be collected or stored in incorrect format which might become very difficult to analyse the data. Also, there should not be any missing data!
Coding the data, formatting the same can happen at this stage. For instance, if the head of the family is Female, the likelihood of being BPL is relatively higher than the case of a Male being the head of the family. Similarly, if the family owns the land or house or heavy weight vehicles like tractor, it’s a sign that they might not fall under BPL. Hence, we can code as 1 for owning the land and 0 for otherwise.
Step 4) Data Analysis
Using the assigning weights or scoring technique, each family can be assessed using the scorecard. Based on this metric, we can classify them as BPL or not. This is one way of solving the problem.
Alternatively, Regression model, which is one of the renowned and widely used statistical concepts, can also be used based on training data. A training data, say 10,000 records, each record representing the family declaring them as BPL or not. Using this data, Is_BPL (containing Yes/No data) can act as the dependent variable and other variables discussed in step 2 can act as independent variables.
Regression would plot an equation. Using this mathematical expression, the surveyed data of each family would be inputted and the outcome of the model would be Yes/No (1/0) indicating if the family falls under BPL or not.
Step 5) Data Interpretation
If the model is well developed using the programming languages such as R, SAS, it would simply emit out if the family is BPL or not when we input the details.
At the granular level, the job would be made easier! Also, it’s to be noted that accuracy of this type of project would not be practically 100% since it’s very difficult to implement in a country which has huge population. An accuracy of 70%-80% would still be good for the model to be delivered to the concerned authorities.
Step 6) Call to Action
The last but the crucial step of this project is to call for action. The Government, at this stage, has the database of the district and if the families are BPL or not. They can sort out the first 5,000 of them and offer the smart cards to be made usable by them for Government welfare schemes.
In a nutshell, these are the steps involved in any analytics projects:
I came across an article written by Vincent at Data Science Central blog. Hope you enjoy reading this one, too!