
Data Models: The Foundation of Successful Analytics
Data Model
A data model is a conceptual representation of data, defining its structure, relationships, and constraints. It serves as a blueprint for creating a database. Data models can be categorized into:
- Conceptual data model: High-level representation of data, focusing on entities and relationships.
- Logical data model: Defines data structures and relationships in detail, independent of any specific database system.
- Physical data model: Specifies how data is physically stored in a database.
Facts and Dimensions
In data warehousing, facts and dimensions are essential concepts:
- Facts: Numerical data that represents measurements or metrics, such as sales, profit, or quantity.
- Dimensions: Attributes that provide context to facts, like time, product, customer, or location.
For instance, in a sales data warehouse, “sales amount” is a fact, while “product category,” “customer,” and “date” are dimensions.
ER Diagram (Entity-Relationship Diagram)
An ER diagram visually represents the relationships between entities (tables) and their attributes (columns) in a database. It’s a common tool for designing relational databases.
- Entities: Represent objects or concepts (e.g., Customer, Product)
- Attributes: Characteristics of entities (e.g., Customer Name, Product Price)
- Relationships: Connections between entities (e.g., Customer buys Product)
Example:

ER diagram showing customers, orders, and products. Image credit:- https://www.gleek.io/templates/er-order-process
Building Customer Analytics Use-Cases
To build customer analytics use-cases, you’ll need to define relevant facts and dimensions, and create a data model that supports your analysis.
Example #1: Propensity to Buy Model
- Facts: Purchase history, browsing behavior, demographics, marketing campaign exposure.
- Dimensions: Customer, product, time, marketing channel.
- Modeling: Utilize machine learning algorithms (e.g., logistic regression, decision trees) to predict the likelihood of a customer making a purchase based on historical data.
Example #2: Customer Profiling Model
- Facts: Demographic information, purchase history, website behavior, social media interactions.
- Dimensions: Customer, product, time, location.
- Modeling: Create customer segments based on shared characteristics using clustering or segmentation techniques.
Example #3: CLTV (Customer Lifetime Value) Modeling
- Facts: Purchase history, revenue, churn rate, customer acquisition cost.
- Dimensions: Customer, product, time.
- Modeling: Calculate the projected revenue a customer will generate throughout their relationship with the business.
Example #4: Churn Modeling
- Facts: Customer behavior, purchase history, customer support interactions, contract information.
- Dimensions: Customer, product, time.
- Modeling: Identify customers at risk of churning using classification models (e.g., logistic regression, random forest).
Additional Considerations:
- Data Quality: Ensure data accuracy, completeness, and consistency.
- Data Enrichment: Incorporate external data sources (e.g., weather, economic indicators) to enhance analysis.
- Data Visualization: Use tools like Tableau, Power BI, or Python libraries (Matplotlib, Seaborn) to visualize insights.
- Model Evaluation: Continuously monitor and evaluate model performance to ensure accuracy and relevance.
By effectively combining data modeling, fact and dimension analysis, and appropriate statistical techniques, you can build robust customer analytics models to drive business decisions.

Prominent Conferences & Events in Data & Analytics field
The data and analytics landscape is dynamic, with numerous conferences and events emerging every year. Here are some of the most prominent ones:
- AI & Big Data Expo: https://www.ai-expo.net/
- AI Summit (series of global events): https://newyork.theaisummit.com/, https://london.theaisummit.com/
- AAAI Conference on Artificial Intelligence: https://aaai.org/conference/
- NeurIPS (Conference on Neural Information Processing Systems): https://neurips.cc/
- ICML (International Conference on Machine Learning): https://icml.cc/
- KDD (ACM SIGKDD Conference on Knowledge Discovery and Data Mining): https://www.kdd.org/
- O’Reilly Strata Data Conference: https://www.oreilly.com/conferences/strata-data-ai.html
- World Summit AI: https://worldsummit.ai/
- ODSC (Open Data Science Conference): https://odsc.com/
- IEEE Big Data: http://bigdataieee.org/
- Gartner Data & Analytics Summit: https://www.gartner.com/en/conferences/calendar/data-analytics
- Data Science Conference: https://www.datascienceconference.com/
- PyData (various global events): https://pydata.org/
- AI World Conference & Expo: https://aiworld.com/
- Deep Learning Summit (series by RE•WORK): https://www.re-work.co/
- CVPR (Conference on Computer Vision and Pattern Recognition): https://cvpr.thecvf.com/
- ICLR (International Conference on Learning Representations): https://iclr.cc/
- Data Science Salon (industry-specific events): https://www.datascience.salon/
- IBM Think: https://www.ibm.com/events/think/
- Google I/O: https://events.google.com/io/
- Microsoft Ignite: https://myignite.microsoft.com/
- AWS re:Invent: https://reinvent.awsevents.com/
- Spark + AI Summit: https://databricks.com/sparkaisummit
- AI Hardware Summit: https://aihardwaresummit.com/
- Women in Data Science (WiDS) Worldwide Conference: https://www.widsconference.org/
- AIM Data Engineering, Cypher, MachineCon Summits https://analyticsindiamag.com/our-events/
These premier events in Data & Analytics are essential for professionals looking to stay ahead in their fields. They offer unparalleled opportunities to learn from leading experts, network with peers, and discover the latest innovations and best practices. Whether you are a researcher, practitioner, or business leader, attending these events can provide valuable insights and connections that drive your work and career forward.

The Powerhouses of Modern Computing: CPUs, GPUs, NPUs, and TPUs
The rapid advancement of technology has necessitated the development of specialized processors to handle increasingly complex computational tasks. This article delves into the core components of these processing units – CPUs, GPUs, NPUs, and TPUs – and their primary use cases.
Central Processing Unit (CPU)
The CPU, often referred to as the “brain” of a computer, is a versatile processor capable of handling a wide range of tasks. It excels in sequential operations, making it suitable for general-purpose computing.
- Key features: Sequential processing, efficient handling of complex instructions.
- Primary use cases: Operating systems, office applications, web browsing, and general-purpose computing.
Graphics Processing Unit (GPU)
Originally designed for rendering graphics, GPUs have evolved into powerful parallel processors capable of handling numerous calculations simultaneously.
- Key features: Parallel processing, massive number of cores, high computational power.
- Primary use cases: Machine learning, deep learning, scientific simulations, image and video processing, cryptocurrency mining, and gaming.
Neural Processing Unit (NPU)
Designed specifically for artificial intelligence workloads, NPUs are optimized for tasks like image recognition, natural language processing, and machine learning.
- Key features: Low power consumption, high efficiency for AI computations, specialized hardware accelerators.
- Primary use cases: Mobile and edge AI applications, computer vision, natural language processing, and other AI-intensive tasks.
Tensor Processing Unit (TPU)
Developed by Google, TPUs are custom-designed ASICs (Application-Specific Integrated Circuits) optimized for machine learning workloads, particularly those involving tensor operations.
- Key features: High performance, low power consumption, specialized for machine learning workloads.
- Primary use cases: Deep learning, machine learning research, and large-scale AI applications.
Other Specialized Processors
Beyond these core processors, several other specialized processors have emerged for specific tasks:
- Field-Programmable Gate Array (FPGA): Highly customizable hardware that can be reconfigured to perform various tasks. Ex: Signal processing
- DPU or Data Processing Unit, is a specialized processor designed to offload data-intensive tasks from the CPU. It’s particularly useful in data centers where it handles networking, storage, and security operations. By taking over these functions, the DPU frees up the CPU to focus on more complex computational tasks. Primary use-cases include Data center infrastructure, Security & Encryption tasks
- VPU or Vision Processing Unit, is specifically designed to accelerate computer vision tasks. It’s optimized for image and video processing, object detection, and other AI-related visual computations. VPUs are often found in devices like smartphones, AR/VR, surveillance cameras, and autonomous vehicles.
The Interplay of Processors
In many modern systems, these processors often work together. For instance, a laptop might use a CPU for general tasks, a GPU for graphics and some machine learning workloads, and an NPU for specific AI functions. This combination allows for optimal performance and efficiency.
The choice of processor depends on the specific application and workload. For computationally intensive tasks like machine learning and deep learning, GPUs and TPUs often provide significant performance advantages over CPUs. However, CPUs remain essential for general-purpose computing and managing system resources.
As technology continues to advance, we can expect even more specialized processors to emerge, tailored to specific computational challenges. This evolution will drive innovation and open up new possibilities in various fields.
In Summary:
- CPU is a general-purpose processor for a wide range of tasks.
- GPU is specialized for parallel computations, often used in graphics and machine learning.
- TPU is optimized for AI/ML operations.
- NPU is optimized for neural network operations.
- DPU is designed for data-intensive tasks in data centers.
- VPU is specialized for computer vision tasks.

OpenAI’s Path to Artificial General Intelligence (AGI)
OpenAI, a leading artificial intelligence research laboratory, has outlined a five-level framework to measure progress towards achieving Artificial General Intelligence (AGI). This framework provides a structured approach to understanding the complexities and potential implications of AI development.
Level 1: Conversational AI – chatbots with conversational language
- Focus: Developing AI systems capable of engaging in natural and informative conversations.
- Example: ChatGPT, Google Bard
- Benefits: Revolutionize customer service, education, and mental health support. Improve accessibility to information and facilitate human-computer interaction.
Level 2: Reasoners – human-level problem solving
- Focus: Creating AI systems that can solve complex problems, requiring reasoning, planning, and learning.
- Example: AI systems capable of drafting legal documents, conducting scientific research, or developing complex software.
- Benefits: Accelerate scientific discovery, increase efficiency in various fields like medicine and engineering.
Level 3: Autonomous Agents – systems that can take actions independently
- Focus: Building AI systems capable of operating independently in complex environments, making decisions, and taking actions.
- Example: Self-driving cars, robots capable of performing household tasks, or AI systems managing complex infrastructure.
- Benefits: Transform transportation, improve quality of life, and enhance efficiency in industries like manufacturing and logistics.
Level 4: Innovators – AI that can aid in invention
- Focus: Developing AI systems capable of generating new ideas and solutions, demonstrating creativity and adaptability.
- Example: AI systems designing new drugs, creating innovative products, or composing music.
- Benefits: Drive economic growth, foster innovation, and potentially lead to breakthroughs in fields like art, science, and technology.
Level 5: Organizational Equivalents – AI that can do the work of an organization
- Focus: Creating AI systems capable of operating as entire organizations, making strategic decisions, and adapting to changing environments.
- Example: AI systems managing complex businesses, governments, or non-profit organizations.
- Benefits: Revolutionize governance, economic systems, and societal structures. However, also raises significant ethical and societal challenges.
According to Bloomberg, OpenAI believes its technology is approaching the second level of five on the path to artificial general intelligence. It’s important to note that this framework is a conceptual roadmap and the exact boundaries between levels may be fluid. Additionally, achieving each level represents a significant technological leap and will likely require substantial advancements in hardware, algorithms, and data.
While the potential benefits of AGI are immense, it’s crucial to address the associated challenges and risks, such as job displacement, bias, and the potential for misuse. OpenAI and other leading AI research organizations are actively working on developing safety protocols and ethical guidelines to ensure that AGI benefits humanity as a whole.
References:
https://www.bloomberg.com/news/articles/2024-07-11/openai-sets-levels-to-track-progress-toward-superintelligent-ai?embedded-checkout=true&sref=HrWXCALa
https://www.forbes.com/sites/jodiecook/2024/07/16/openais-5-levels-of-super-ai-agi-to-outperform-human-capability

The Ops Revolution
The world of technology is rapidly evolving, and with it, a plethora of new operational methodologies have emerged. These “Ops” terms, while often confusing, are essential to understanding the modern IT landscape. Let’s break down some of the most prominent ones.
1. DevOps
DevOps combines “Development” and “Operations,” focusing on integrating software development and IT operations.
Roles & Responsibilities:
- Automating and streamlining the software development lifecycle
- Implementing continuous integration and continuous deployment (CI/CD) pipelines
- Fostering collaboration between development and operations teams
- Managing infrastructure as code
Skills Required:
- Programming and scripting (e.g., Python, Shell scripting)
- Containerization and orchestration (e.g., Docker, Kubernetes)
- CI/CD tools (e.g., Jenkins, GitLab CI)
- Version control systems (e.g., Git)
- Cloud platforms (e.g., AWS, Azure, GCP)
2. AIOps
AIOps stands for “Artificial Intelligence for IT Operations,” using AI and machine learning to enhance IT operations.
Roles & Responsibilities:
- Implementing AI-driven monitoring and alert systems
- Automating incident response and problem resolution
- Predictive analytics for capacity planning and performance optimization
- Enhancing root cause analysis
Skills Required:
- Machine learning and AI algorithms
- Data analysis and visualization
- Programming (e.g., Python, R)
- IT infrastructure knowledge
- Familiarity with AIOps platforms (e.g., Moogsoft, Dynatrace)
3. MLOps
MLOps, or “Machine Learning Operations,” focuses on streamlining the machine learning lifecycle in production environments.
Roles & Responsibilities:
- Automating ML model deployment and monitoring
- Ensuring reproducibility of ML experiments
- Managing ML model versions and datasets
- Optimizing ML infrastructure and resources
Skills Required:
- Machine learning and deep learning frameworks (e.g., TensorFlow, PyTorch)
- Programming (especially Python)
- Data engineering
- Version control for ML models and data
- Familiarity with MLOps tools (e.g., MLflow, Kubeflow)
4. CloudOps
CloudOps, or “Cloud Operations,” involves managing and optimizing cloud-based infrastructure and services.
Roles & Responsibilities:
- Monitoring and optimizing cloud resource usage
- Implementing cloud security best practices
- Managing multi-cloud and hybrid cloud environments
- Automating cloud provisioning and scaling
Skills Required:
- Cloud platforms (AWS, Azure, GCP)
- Infrastructure as Code (e.g., Terraform, CloudFormation)
- Networking and security in cloud environments
- Containerization and orchestration
- Cost optimization strategies
5. FinOps
FinOps, or “Financial Operations,” focuses on optimizing the financial aspects of cloud and IT operations.
Roles & Responsibilities:
- Monitoring and forecasting cloud spending
- Implementing cost optimization strategies
- Aligning cloud costs with business value
- Promoting financial accountability across teams
Skills Required:
- Cloud cost management tools
- Financial analysis and budgeting
- Data analysis and visualization
- Understanding of cloud pricing models
- Stakeholder communication
6. DataOps
DataOps applies DevOps principles to data analytics, aiming to improve the quality and reduce the cycle time of data analytics.
Roles & Responsibilities:
- Automating data pipelines and workflows
- Ensuring data quality and governance
- Implementing version control for data and analytics code
- Facilitating collaboration between data scientists, engineers, and analysts
Skills Required:
- Data engineering and ETL processes
- Programming (e.g., Python, SQL)
- Big data technologies (e.g., Hadoop, Spark)
- Data visualization tools
- Version control and CI/CD for data pipelines
7. DevSecOps
DevSecOps integrates security practices into the DevOps process, emphasizing security throughout the software development lifecycle.
Roles & Responsibilities:
- Implementing security automation in CI/CD pipelines
- Conducting regular security assessments and penetration testing
- Developing and enforcing security policies
- Promoting security awareness among development teams
Skills Required:
- Application security and secure coding practices
- Security testing tools and methodologies
- Cloud security
- Compliance and regulatory knowledge
- DevOps tools and practices
These “Ops” terms represent a shift towards automation, collaboration, and data-driven decision-making in IT operations. As technology continues to evolve, we can expect to see even more specialized “Ops” roles emerge.

The World of Databases – From SQL to NoSQL to Beyond
The landscape of databases has evolved significantly over the years, transitioning from traditional relational databases to a variety of modern databases designed to meet the diverse and complex needs of today’s data-driven world. This article explores different types of traditional and modern databases, highlighting their unique features, use-cases, and key examples.

1. Relational Databases
Overview: Relational databases have been the cornerstone of data management for decades. They organize data into tables with rows and columns, making it easy to query and maintain data integrity through relationships between tables.
Key Examples:
- MySQL: Widely used in web applications, known for its robustness and scalability.
- PostgreSQL: An advanced relational database known for its support of complex queries and extensibility.
Use-Cases:
- Business Intelligence (BI): Relational databases are ideal for transactional applications and BI systems that require structured data and complex queries.
- Enterprise Applications: Used in ERP, CRM, and other enterprise systems where data consistency and integrity are crucial.
2. NoSQL Databases
Overview: NoSQL databases are designed to handle unstructured or semi-structured data, offering flexibility, scalability, and performance for various applications. They are categorized into several types, including document, key-value, column-family, and graph databases.
Key Examples:
- MongoDB (Document Database): Known for its flexibility, scalability, and ease of use.
- Apache Cassandra (Column-Family Database): Renowned for its high availability and scalability.
- Neo4j (Graph Database): Powerful for managing and querying complex relationships and interconnected data.
- Redis (Key-Value Database): An in-memory database known for its speed and versatility.
Use-Cases:
- Content Management Systems: Document databases like MongoDB are perfect for managing varying data types such as blogs, articles, and multimedia.
- Real-Time Analytics: Key-value databases like Redis are suitable for applications requiring quick read and write operations.
- Big Data Applications: Column-family databases like Apache Cassandra are ideal for handling large volumes of data across multiple nodes.
- Social Networks and Fraud Detection: Graph databases like Neo4j excel in analyzing relationships and connections.
3. Document Databases
Overview: Document databases store data in a semi-structured format, typically using JSON-like documents. This flexibility allows for varying data structures and is ideal for applications requiring rapid development and iteration.
Key Example:
- MongoDB: A popular document database known for its flexibility, scalability, and ease of use.
Use-Cases:
- Content Management Systems: Perfect for applications managing varying data types such as blogs, articles, and multimedia.
- Real-Time Analytics: Suitable for applications requiring quick read and write operations.
4. Graph Databases
Overview: Graph databases use graph structures with nodes, edges, and properties to represent and store data. They excel in managing and querying complex relationships and interconnected data.
Key Example:
- Neo4j: A leading graph database known for its powerful graph traversal capabilities and ease of use in representing relational data.
Use-Cases:
- Social Networks: Ideal for applications requiring analysis of relationships and connections, such as friend networks and recommendation engines.
- Fraud Detection: Useful in identifying and analyzing complex fraud patterns through relationships and interactions.
5. Column-Family (Distributed) Databases
Overview: Column-family databases, often referred to as distributed databases, store data in columns rather than rows, enabling efficient retrieval of large datasets and horizontal scalability.
Key Example:
- Apache Cassandra: Known for its high availability and scalability, making it suitable for handling large volumes of data across multiple nodes.
Use-Cases:
- Big Data Applications: Suitable for applications requiring storage and analysis of massive datasets, such as IoT data and log management.
- Real-Time Data Processing: Ideal for applications that need to process and analyze data in real-time across distributed environments.
6. Time-Series Databases
Overview: Time-series databases are optimized for handling time-stamped data, such as logs, metrics, and sensor data. They are designed to efficiently ingest, store, and query time-series data.
Key Example:
- InfluxDB: A popular time-series database known for its high write throughput and efficient storage of time-series data.
Use-Cases:
- Monitoring Systems: Ideal for applications tracking system performance metrics, financial data, and IoT sensor data.
- Forecasting and Trend Analysis: Suitable for applications requiring analysis of trends over time, such as stock prices and weather data.
7. Key-Value Databases
Overview: Key-value databases store data as a collection of key-value pairs, offering simplicity and high performance for applications requiring fast and simple data retrieval.
Key Example:
- Redis: An in-memory key-value database known for its speed and versatility, often used as a cache or message broker.
Use-Cases:
- Caching: Ideal for applications requiring rapid access to frequently accessed data, such as session management and content caching.
- Real-Time Analytics: Suitable for applications needing quick data retrieval and updates.
8. Vector Databases
Overview: Vector databases are designed to handle vector embeddings, which are essential for machine learning (ML) and deep learning (DL) applications. They enable efficient storage and retrieval of high-dimensional vector data.
Key Example:
- Milvus: An open-source vector database optimized for similarity search and scalable storage of vector data.
Use-Cases:
- Machine Learning: Ideal for applications involving similarity search, recommendation systems, and natural language processing.
- Deep Learning: Suitable for storing and querying embeddings generated by neural networks.
9. Search Engines
Overview: Search engines like Elasticsearch are designed for full-text search, log, and event data analysis, providing powerful search capabilities over large volumes of unstructured data.
Key Example:
- Elasticsearch: A distributed, RESTful search and analytics engine capable of handling large-scale search and data analysis.
Use-Cases:
- Log and Event Data Analysis: Ideal for applications requiring real-time log monitoring and analysis.
- Full-Text Search: Suitable for applications needing robust search capabilities, such as websites and enterprise search solutions.
10. Cloud-Based Databases
Overview: Cloud-based databases offer scalable, managed database solutions that leverage cloud infrastructure for high availability, flexibility, and reduced operational overhead.
Key Example:
- Amazon SageMaker: While primarily an ML platform, it provides managed services for data preparation, model training, and deployment, integrating seamlessly with other AWS database services.
Use-Cases:
- Data Science and Machine Learning: Ideal for end-to-end ML workflows, from data ingestion to model deployment and monitoring.
- Scalable Applications: Suitable for applications requiring elastic scalability and managed database services.
Conclusion
The choice of database technology plays a critical role in the success of modern applications. Understanding the strengths and use-cases of different types of databases—relational, NoSQL, document, graph, column-family, time-series, key-value, vector, search engines, and cloud-based—enables organizations to make informed decisions that align with their specific needs. By leveraging the right database for the right application, businesses can achieve greater efficiency, scalability, and innovation in their data-driven endeavors.

Figure Unveiled a Humanoid Robot in Partnership with OpenAI
A yet another milestone in the history of A.I. and Robotics!
Yes, I’m not exaggerating! What you could potentially read in a moment would be a futuristic world where humanoid robots can very well serve humanity in many ways (keeping negatives out of the picture for timebeing).
When I first heard this news, movies such as I, Robot and Enthiran, the Robot were flashing on my mind! Putting my filmy fantasies aside, the Robotics expert company Figure, in partnership with Microsoft and OpenAI, has released the first general purpose humanoid robot – Figure 01 – designed for commercial use.
Here’s the quick video released by the creators –
Figure’s Robotics expertise has been perfectly augmented by OpenAI’s multi-modal support in understanding and generating response of visual inputs such as image, audio, video. The future looks way more promising and becoming reality that these humanoids can be supplied to the manufacturing and commercial areas where there are shortage of resources for scaling the production needs.
In the video, it is seen demonstrating the ability to recognize objects such as apple and take appropriate actions. It is reported that Figure 01 humanoid robot stands at 5 feet 6 inches tall and weighs 132 pounds. It can carry up to 44 pounds and move at a speed of 1.2 meters per second.

Figure is backed by tech giants such as Microsoft, OpenAI Startup Fund, NVIDIA, Jeff Bezos (Bezos Expeditions) and more.
Lot of fascinating innovations happening around us thanks to Gen AI / LLMs, Copilot, Devin, Sora, and now a glimpse into the reality of Humanoid Robotics. Isn’t it a great time to be in?!

Meet Devin, the first AI-based Software Engineer
Gen AI enables writing highly sophisticated code for the given problem statement. Developers can already take advantage of that!
What if a full-fledged tool that can write code, fix bugs, leverages online resources, collaborates with human, and solves gigs on popular freelancing sites such as Upwork?!
Is this a fiction? Well, not anymore.
Meet Devin, the first of its kind, AI-based software engineer, created by Cognition Labs, an applied AI labs company that builds apps focusing on reasoning.

The Tech World is already amazed with the capabilities of Copilot which assists in developing code snippets, however, Devin has a unique capability and is a step-up in terms of its features that it can cater to end-to-end software development.
According to the creators, Devin has the following key capabilities as of writing –
- Learn how to use unfamiliar technologies.
- Build and deploy apps end to end.
- Autonomously find and fix bugs in codebases.
- Train and fine tune its own AI models.
- Address bugs and feature requests in open source repositories.
- Contribute to mature production repositories.
- Solve real jobs on Upwork!
Scott Wu, the founder and CEO of Cognition, explained Devin can access common developer tools, including its own shell, code editor and browser, within a sandboxed compute environment to plan and execute complex engineering tasks requiring thousands of decisions.
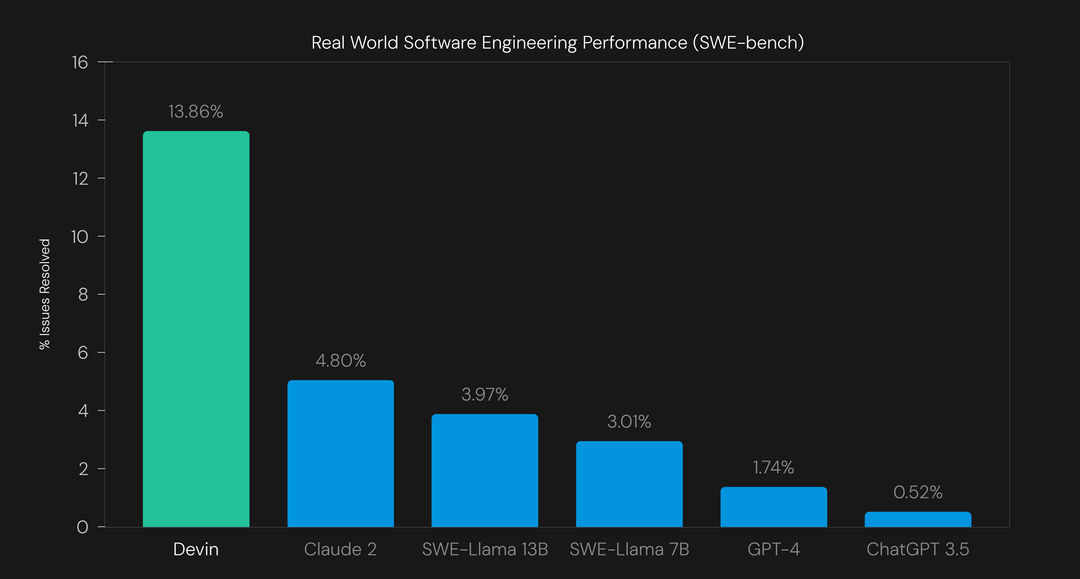
Devin resolved 13.86% of issues without human assistance in the tested GitHub repositories as per the publication by creators based on SWE-benchmark that asks agents to resolve challenging problems in the open-source projects such as scikit-learn, Django.
There’s sparkling conversation around the globe that AI could kill basic coding skills written by human and recently NVidia Founder talked about everyone is now a programmer thanks to AI. Of course, I think, human oversight is required to refine and meet user’s requirements.
Thanks to Devin, now the human can focus more on complex or interesting problems that requires our creativity and best use of our time. As of now, access to Devin is only limited to select individuals. Public access is still pending. For more info, visit cognition-labs.com/blog
Guess which industry tops the AI maturity index
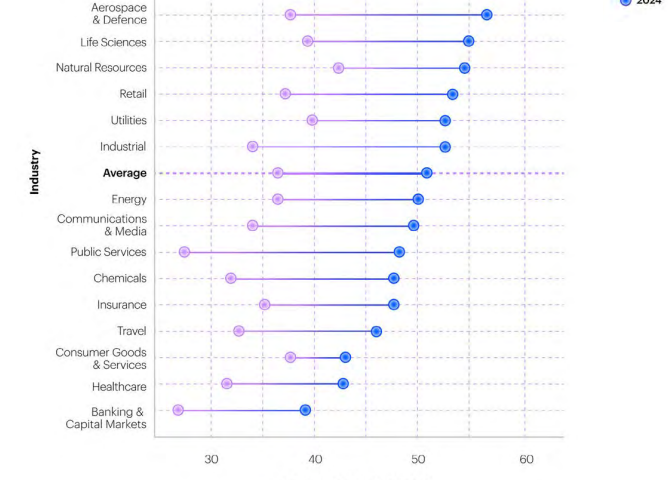
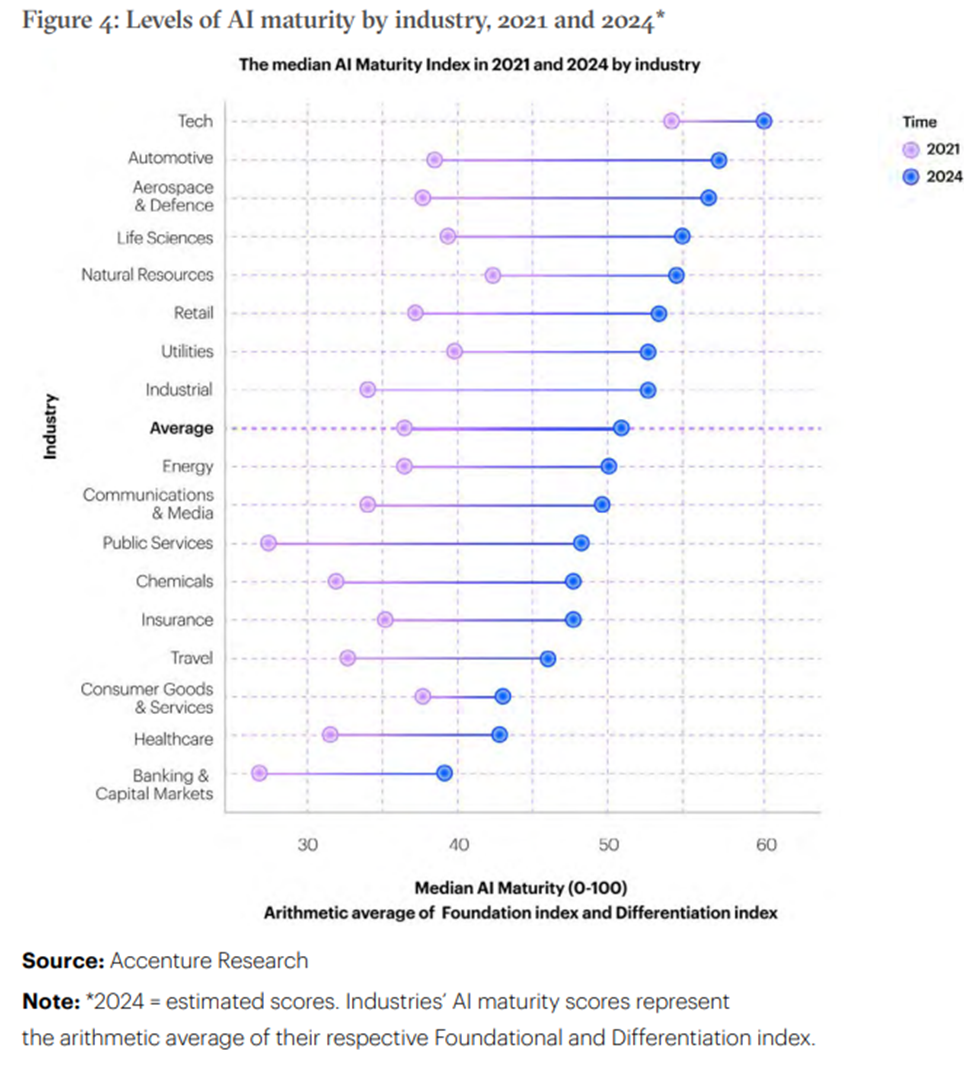
Hey there! I came across this article from Accenture Research capturing the AI maturity index across various industries in 2021 and 2024 (estimated).
It’s quite obvious that Tech industry steals the AI show here! The range of companies – Google, Meta, Amazon, Apple, Microsoft etc., are striving hard to innovate and compete to gain the market space when it comes to AI-led products and solutions.
Automotive bags the number two spot thanks to AI-led self-driving / autonomous vehicles trend. Followed by Aerospace and Defence for AI-enabled remote systems. Life Sciences companies conduct experiments to reduce the drug development time using AI.
Accenture Research reveals that there are enormous opportunities for companies to seize in this space.
One thing that I particularly find it surprising is, Banking & Insurance industry which show relatively lower AI maturity compared to other industries. In general, BFSI as a sector, undertakes IT and Data or AI-led projects in-house (global capability centers) or using outsourced partners. BFSI has lot of room for AI penetration across their functions such as Customer Experience, Sales & Marketing, Finance & Investments.
Common challenges plaguing the AI adoption indicated in the research are
- Legal and regulatory challenges
- Inadequate AI infrastructure
- Shortage of AI-trained workers
Meta’s Large Language Model – LLaMa 2 released for enterprises
Meta, the parent company of Facebook, unveiled the latest version of LLaMa 2 for research and commercial purposes. It’s released as open-source unlike OpenAI GPT / Google Bard which is proprietary.
What is LLaMa?
LLaMa (Large Language Model Meta AI) is an open-source language model built by Meta’s GenAI team for research. LLaMa 2 which is newly released for research and commercial uses.
Difference between LLaMa and LLaMa 2
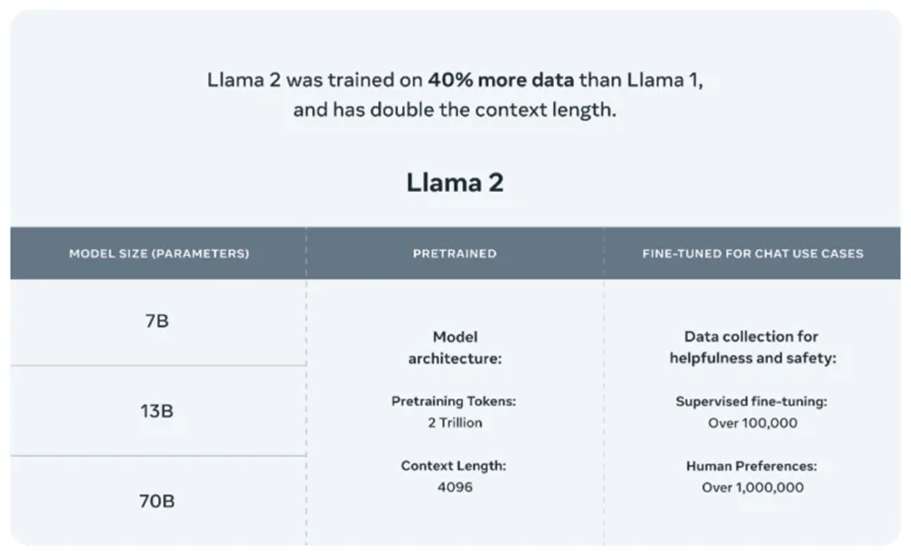
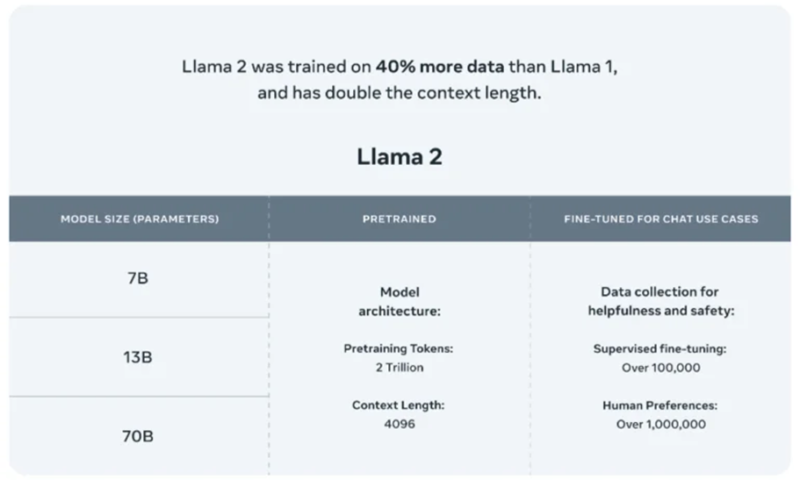
LLaMa 2 model was trained on 40% more data than its predecessor. Al-Dahle (vice president at Meta who is leading the company’s generative AI work) says there were two sources of training data: data that was scraped online, and a data set fine-tuned and tweaked according to feedback from human annotators to behave in a more desirable way. The company says it did not use Meta user data in LLaMA 2, and excluded data from sites it knew had lots of personal information.
Newly released LLaMa 2 models will not only further accelerate the LLM research work but also enable enterprises to build their own generative AI applications. LLaMa 2 includes 7B, 13B and 70B models, trained on more tokens than LLaMA, as well as the fine-tuned variants for instruction-following and chat.
According to Meta, its LLaMa 2 “pretrained” models are trained on 2 trillion tokens and have a context window of 4,096 tokens (fragments of words). The context window determines the length of the content the model can process at once. Meta also says that the LLaMa 2 fine-tuned models, developed for chat applications similar to ChatGPT, have been trained on “over 1 million human annotations.”
Databricks highlights the salient features of such open-source LLMs:
- No vendor lock-in or forced deprecation schedule
- Ability to fine-tune with enterprise data, while retaining full access to the trained model
- Model behavior does not change over time
- Ability to serve a private model instance inside of trusted infrastructure
- Tight control over correctness, bias, and performance of generative AI applications
Microsoft says that LLaMa 2 is the latest addition to their growing Azure AI model catalog. The model catalog, currently in public preview, serves as a hub of foundation models and empowers developers and machine learning (ML) professionals to easily discover, evaluate, customize and deploy pre-built large AI models at scale.
OpenAI GPT vs LLaMa
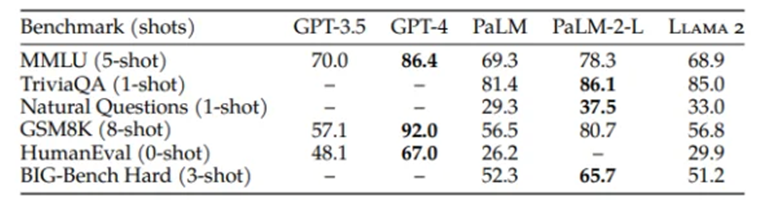
A powerful open-source model like LLaMA 2 poses a considerable threat to OpenAI, says Percy Liang, director of Stanford’s Center for Research on Foundation Models. Liang was part of the team of researchers who developed Alpaca, an open-source competitor to GPT-3, an earlier version of OpenAI’s language model.
“LLaMA 2 isn’t GPT-4,” says Liang. Compared to closed-source models such as GPT-4 and PaLM-2, Meta itself speaks of “a large gap in performance”. However, ChatGPT’s GPT-3.5 level should be reached by Llama-2 in most cases. And, Liang says, for many use cases, you don’t need GPT-4.
A more customizable and transparent model, such as LLaMA 2, might help companies create products and services faster than a big, sophisticated proprietary model, he says.
“To have LLaMA 2 become the leading open-source alternative to OpenAI would be a huge win for Meta,” says Steve Weber, a professor at the University of California, Berkeley.
LLaMA 2 also has the same problems that plague all large language models: a propensity to produce falsehoods and offensive language. The fact that LLaMA 2 is an open-source model will also allow external researchers and developers to probe it for security flaws, which will make it safer than proprietary models, Al-Dahle says.
With that said, Meta has set to make its presence felt in the open-source AI space as it has announced the release of the commercial version of its AI model LLaMa. The model will be available for fine-tuning on AWS, Azure and Hugging Face’s AI model hosting platform in pretrained form. And it’ll be easier to run, Meta says — optimized for Windows thanks to an expanded partnership with Microsoft as well as smartphones and PCs packing Qualcomm’s Snapdragon system-on-chip. The key advantage of on-device AI is cost reduction (cloud per-query costs) and data security (as data solely remain on-device)
LLaMa can turn out to be a great alternative for pricy proprietary models sold by OpenAI like ChatGPT and Google Bard.
References:
https://ai.meta.com/llama/?utm_pageloadtype=inline_link
https://www.technologyreview.com/2023/07/18/1076479/metas-latest-ai-model-is-free-for-all/
https://www.databricks.com/blog/building-your-generative-ai-apps-metas-llama-2-and-databricks