
Application of Analytics in Business
Analytics is in the process of transitioning from being niche and only used by few companies & their business functions to mainstream now. The penetration of it is so wide since its application can be made useful across all the business groups of the organization.
It paved the way to new roles in the companies such as Data Analyst, Data Scientist. You need not get surprised if there’s a role such as CAO – Chief Analytics Offer in any company 🙂
I was researching few weeks ago and found that its application is proliferated & penetrated across all major domains.
1) Sales
Measuring Sales force effectiveness is key to forecast how many products could be sold by a company in a given period of time. Forecasting sales data in a certain region at the sales folks level is essential to ensure if the company could meet the target assigned to that particular geography. KPI metrics will be an useful aide during this process.
A simple time series forecasting might throw the pattern based on historical data. Using this, you can adjust or transition the sales folks between different product lines or regions to achieve the targets within certain time-frame. For example, if your focus is on acquiring more B2B merchants, you can deploy more sales people in B2B sales team rather than B2C.
2) Marketing
Its sole existence is to understand the customers’ behaviors and offer the customized services ahead of your competitors.
In this space, I can think of at least 3 companies which have offered me unmatched and personalized services. a) Amazon for recommending me the best product based on my previous purchase orders and browsing history. Until now, I’ve not discovered any other service which can recommend me best books as Amazon’s recommendation engine does! b) Uber for customized coupons and reengaging me to its business as I’m mostly using Ola of late (I feel perhaps it’s because of availability of cabs), c) Dominios Pizza for attractive coupons based on my history of buying with them using mobile app.
Life Time Value (LTV) of the customer is a key metric for these companies and they would maximize their product offerings to improve its value.
3) Operations
Supply Chain analytics is a specialized area of focus especially for e-commerce companies.
Just think of it this way – you ordered a book of worth 150 bucks and you’re not there to pick the order when the delivery is attempted. The logistics company tries for 3 days and the company would be investing in arranging the delivery for 3 times in 3 days. This cost is not sustainable and ROI is negligible or sometimes even go negative for them! Based on these data, “reverse logistics” was introduced by DTDC which means the logistic company ties up with your nearby mom & pop store such that you can pick up the order at your convenience.
4) HR
Of course, employees are the biggest assets of any organization! I can’t agree more on this!!
There are analytical models which can understand the factors influencing the employees to leave, predict which employee to leave, predict which employee is more suitable for a given position or fit mapping, reengaging employees with training and fun programs, thereafter measuring the ROI of it.
5) Finance
Risk and fraud prevention is crucial for individuals and corporations. The financial institutions, be it a bank or a credit card company for instance, employed techniques that can alert and flag the unusual transactions in real-time.
Hope this article gave you a heads-up on how the use of analytics in major business functions is taking place.

Steps Involved in Analytics Projects
I’ve been working on various Software Development Life Cycles such as Waterfall, Agile Scrum.
In a typical software project, I see there are 6 steps involved:
1) Requirements elicitation (gathering),
2) Designing,
3) Implementation,
4) Testing,
5) Deployment and
6) Maintenance (Support)
These best practices enable us to be focused on the deliverable and keep a tab on the timeline. The same thought process can be applied for any analytics projects as well. This article gives you a perspective on the steps involved in the analytics projects.
Let’s take a simple example to go over the steps in detail.
This example is created for illustration purpose.
Step 1) Unstructured to Structured Problem Statement
The Government of a country wants to cut off the intermediaries while distributing the benefits to the poor people. The pain point for the Government is that, its beneficiary schemes are not reaching to the poor people to a great accuracy and degree. And they want to tackle this problem with a better approach.
For this purpose, we can take up the Below Poverty Line (BPL) to measure the poverty of a family. On the international standard, if a family lives with the daily wage of say $1.90, then the family would be categorized to be living under the BPL. To validate if such an experiment would be useful, the committee is thinking to set this up as a pilot project for an identified district of a state.
The aim of this project is to identify 5,000 BPL families in the district and offer them each a smart card. The Government might use the card to transact some amount directly to the beneficiaries eliminating the middle men on a monthly/quarterly basis.
Step 2) Data Collection
This is a very challenging step of the project. Remember, “garbage in, garbage out”? If the quality of your data is bad, then the model or outcome of what you’re intending to bring out would be erroneous. 60% to 70% of the time invested in analytics projects could be utilized during this stage!
The data can be external or internal, in general. Assume that the Government do not have any census data which captured the monthly income of the family to determine if they belong to BPL or not.
In this case, a survey should be rolled out comprising of simple questions and get the answers from each family.
What kind of questions to be asked to each family?
If you too think about asking a direct monthly income based question, then think twice. I had exactly the same viewpoint. However, it won’t work because either the family might underestimate its income or they don’t have the standard daily wages coming in.
Thus, the questions to be framed should somehow cover the income type without even directly touching upon it. Some of the parameters to be considered are: Family size, head of the family (M/F), access to clean water, sanitation, land & house (own/rent), vehicle, education, skill-sets, occupation, weekly or monthly expenses on staple food items etc.
At the end of this exercise, you would have framed the questions. Think of it as a model and assign the score (weight) to each parameter. Using the accumulated score, a family can be determined if BPL or not.
Step 3) Data Processing
The agents who ask questions and capture data on behalf of the Government or the analytics consultant should be educated. At times, the data would be collected or stored in incorrect format which might become very difficult to analyse the data. Also, there should not be any missing data!
Coding the data, formatting the same can happen at this stage. For instance, if the head of the family is Female, the likelihood of being BPL is relatively higher than the case of a Male being the head of the family. Similarly, if the family owns the land or house or heavy weight vehicles like tractor, it’s a sign that they might not fall under BPL. Hence, we can code as 1 for owning the land and 0 for otherwise.
Step 4) Data Analysis
Using the assigning weights or scoring technique, each family can be assessed using the scorecard. Based on this metric, we can classify them as BPL or not. This is one way of solving the problem.
Alternatively, Regression model, which is one of the renowned and widely used statistical concepts, can also be used based on training data. A training data, say 10,000 records, each record representing the family declaring them as BPL or not. Using this data, Is_BPL (containing Yes/No data) can act as the dependent variable and other variables discussed in step 2 can act as independent variables.
Regression would plot an equation. Using this mathematical expression, the surveyed data of each family would be inputted and the outcome of the model would be Yes/No (1/0) indicating if the family falls under BPL or not.
Step 5) Data Interpretation
If the model is well developed using the programming languages such as R, SAS, it would simply emit out if the family is BPL or not when we input the details.
At the granular level, the job would be made easier! Also, it’s to be noted that accuracy of this type of project would not be practically 100% since it’s very difficult to implement in a country which has huge population. An accuracy of 70%-80% would still be good for the model to be delivered to the concerned authorities.
Step 6) Call to Action
The last but the crucial step of this project is to call for action. The Government, at this stage, has the database of the district and if the families are BPL or not. They can sort out the first 5,000 of them and offer the smart cards to be made usable by them for Government welfare schemes.
In a nutshell, these are the steps involved in any analytics projects:

I came across an article written by Vincent at Data Science Central blog. Hope you enjoy reading this one, too!

Boutique Analytics Firms vs. Captive Units
You may be an employee, a consultant or an CXO of a company. How do you view the $16 bn Analytics industry?
Broadly speaking, when you look at Analytics services, it can be offered by companies in two modes:
- Boutique model
- Captive model
Boutique (also called as Niche Analytics companies) Model
The companies fall under this category has deep expertise in the field of Analytics. They can offer services in almost all major domains such as Banking, Finance, Insurance, Manufacturing, Government etc. to name a few.
They have the right set of people trained on domains, tools & techniques required for any analytics projects. Major clients approach (or vice-versa) these companies to help them in analyzing the data. It typically works like how IT outsourcing takes place.
Few companies in India that are operating under this model are

Captive Model
MNC companies who have big ticket investments would set-up their in-house Anaytics division to cater to their tailored needs. For instance, a credit card company can set-up its own analytics team to prevent and alert the fraud transactions happening over its network in the form of a system.
These companies store the highly confidential data, mostly in BFSI space, hires the consultants in setting-up their division. And then the team grows based on the ROI and the type of projects they take up.
Few examples of such companies are

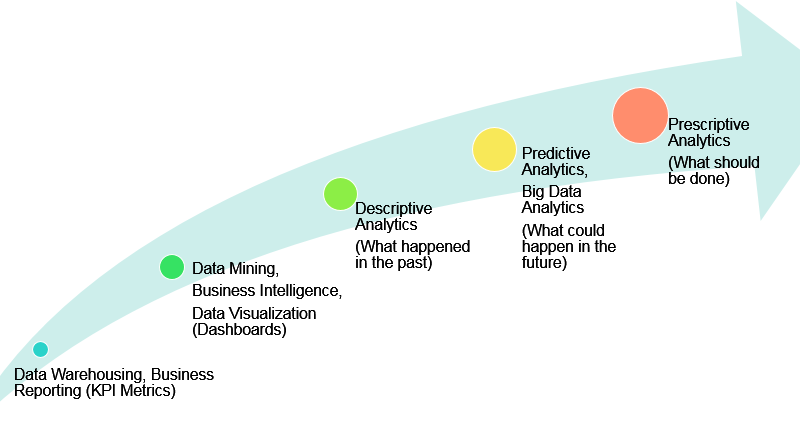
Evolution of Analytics
This really got me thinking. Why is Analytics a buzzword these days?
According to many industry experts that I listened to, this is not a brand new process as such. However, industries are adopting this at a high scale.
Why now? Because of overwhelming data that are accumulated thanks to all the Social Media, Search Engine and especially my most favorite User Generated Content (UGC). With billions of searches on Google, millions of photos being uploaded on Facebook, a million ride thanks to Uber, these cutting-edge software companies have now access to store torrents of data, and make informed decisions out of them!
Just visualize the volume of data being generated every minute, variety of data such as text/multimedia/rich content created and shared, and velocity (past and real-time data). These are the 3 Vs of Big Data! Companies want to make sense out of it to reduce costs, improve revenue, profits and customer satisfaction.
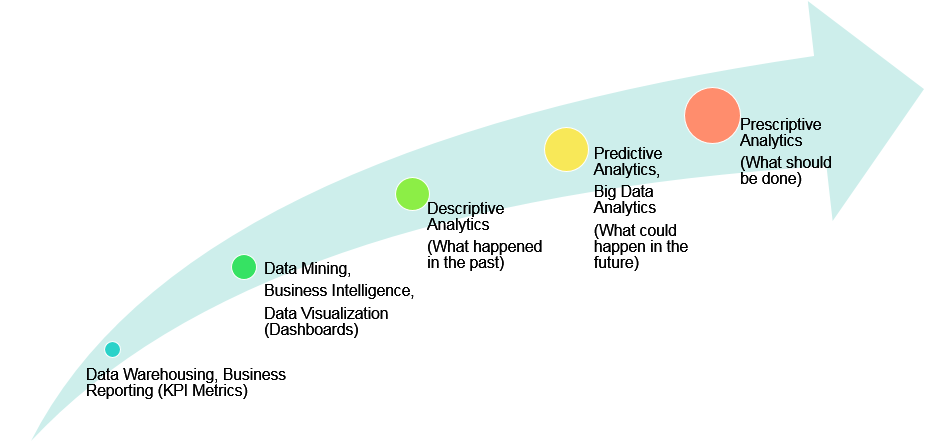
The transition in major companies is evident. From Business Reporting using KPI Metrics to Business Intelligence and Data Visualization + Dashboards to Descriptive Analytics to Predictive Analytics to Prescriptive Analytics.
I’ll write my understanding on these on separate articles.
Skill Sets Required For Analytics
I’m a computer programmer. Can I transition my career or line of work towards Analytics?
That’s what I asked me a question 2-3 years. I didn’t have the answer back then. You too may be curious to know what it takes to be in the Analytics profession?
Firstly, you may have to understand the difference between analysis and analytics. To start with, let’s think through this from the top-down approach perspective.
- What’s the business problem you’re intending to solve? The problem could emerge from your corporate, government or any for that matter. Without understanding the context & background, it’ll be very difficult to structure the problem! To go through this, domain expertise is essential. Having this skill enables you to visualize the big picture from Problem to Probable Solutions.
- Next step is the “How” part. How are you going to solve the problem? You may gather the data, do some analysis using any applied mathematics or statistical concepts, understand the relationship hidden in the data and come up with recommendations. Tools and Programming skills are essential at this stage to perform the steps.
In a nutshell, this is my understanding when it comes to the skill sets required for Analytics.
Well, hold on, don’t jump into making your conclusion! The tools, techniques, programmings evolve and one might replace the other during the course of time. The way to approach in this typical field of Analytics is to become good in one skill and try to learn the other skill sets at the earliest.
You can choose to become a go-to person when it comes to business acumen and you may also learn the A,B,Cs of frequently used Statistical models, tools and programmings. In my case, I have relatively good experience over programming and hence my focus would be on learning statistics, gaining business knowledge.
Each skill set mentioned above is very vast in itself. For instance, there are many statistical models available. There are many programming tools and languages that can cater to analytics these days. When it comes to business, you can drill down to Sales, Marketing, HR, Finance, Operations and so on!
You can choose your level playing field and try to learn something new each day. That’s the key to elevate I believe.
Here are the generic skill sets that I think are most relevant:
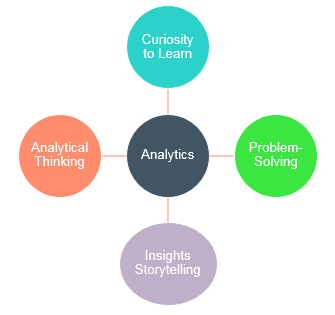
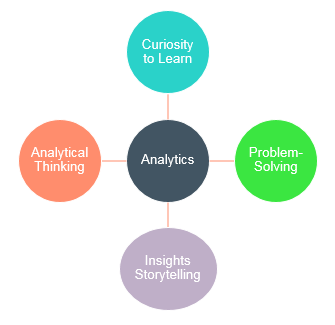
I firmly believe that any skill can be learned. By and large, Analytics is a multi faceted field! Four critical non-technical skills that are required are:
- Curiosity: This is the most important trait one should have. Curiosity to learn, be it in any domain, matters a lot. You can be really good in Sales/Marketing and if you wish to take up an assignment in HR, you should be open-minded to learn new business aspects.
- Analytical Thinking: Most often, we face problems that would be really challenging to solve! You need to frame the structured problem statement from the unstructured & vague problem area.
- Problem-Solving: You don’t need to be a pro in say programming. When you’re clear about what problem you need to solve using programming, you can research and design an algorithm. In good old school days, we use paper and pen. Nostalgic, right? We can get back to that era again by drafting the solution using the same way which is effective. Read articles, whitepapers online which would help you understand how somebody resolved the problems.
- Insights Storytelling: Interpretation of data from the analysis you carried is yet another crucial step of the analytics project. You would need to present the findings/solution to the leadership team in a layman’s language! Conveying your efforts in the form of a story and influencing others to buy your deliverable is an art!
The above holds true for data scientist skill sets as well. However, I’d encourage you to go through an article at KDnuggets.
What do you think is the number one skill required for Analytics? I’m looking forward to read your thoughts via comments below.
Analysis vs. Analytics
Often, we might hear the words – Analysis and Analytics – being interchanged in our usage. Are they quite similar? The answer is no. There’s a fine line of difference between these two terms. Here are my two cents 🙂
Analysis is a way to interpret the data and derive meaningful insights from the data. Essentially, you may use the analytical tools such as Microsoft Excel to plot the graph, pivot, chart to delve into the subject of interest. Let’s take a very simple example: Your executive wants to know, “Who are the top 10 salesforce folks who exceeded the targets this year in U.S. region?”. Well, you can extract the U.S. sales data from the tool and sort it by descending order to arrive at the top 10. Your leadership team might think of a surprise gift vouchers to them as a token of hard-work and determination!
Analytics: This also holds true in deriving meaningful insights from the data. The difference is, analytics involves statistical tools & techniques with business acumen to bring out the hidden patterns, stories from the data. I would say analysis is a sub-set of analytics whereas the latter involves some complex techniques to solve the problem. Ex: Google recommends you search ideas when you start typing your keywords. Let’s say, you want to know “how to make a website”. Google has the search data from your country’s demographics who had already searched about the similar keywords. Using machine learning algorithm in real-time, your search query is suggested by the search engine before you complete the keywords!
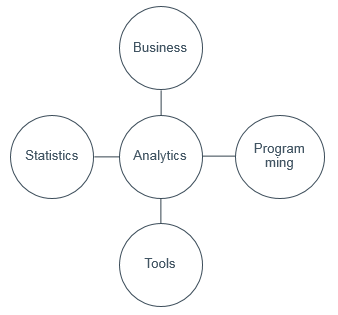
In a nutshell, Analytics = Business + Statistics (Applied Maths) + Computer Programming. Using the statistical tools & techniques, a business problem is solved and that’s analytics for you guys!
Next time, if somebody switches these two terms, ensure you get it clarified! It doesn’t change the context drastically but technically you should be well informed about the discussion points.
If you have any questions or anything to be shared, please write it in the comments section below. I look forward to hear from you.