Introduction to Sentiment Analysis using Stanford NLP

Nowadays consumer forums, surveys, social media are generating huge text content like never before compared to the last decade.

Interesting use-cases can be brand monitoring using social media data, voice of customer analysis etc.

Thanks to research in Natural Language Processing (NLP), many algorithms, libraries have been written in programming languages such as Python for companies to discover new insights about their products and services.

Popular NLP Libraries in Python

NLTK (Natural Language Toolkit) is a huge corpus of human language data built as open-source package for Python language. It performs tasks such as tokenization, parsing, classification, tagging, semantic reasoning.

There are other prominent libraries in place. For instance, Textblob is built on top of NLTK package. And, there are other libraries such as Spacy, Gensim, Stanford Core NLP.

Common NLP Tasks

In a nutshell, there are many text related tasks we can think of such as tokenization, parts of speech (pos) tagger, named entity recognition, coreference resolution, sentiment analysis, stemming, lemmatization, stopwords removal, singularize/pluralize, ngram, spellcheck, summarizing text, topic modeling and the kind of linguistic languages we’re dealing with.

In this article, I’d like to share a simple, quick way to perform sentiment analysis using Stanford NLP.

The outcome of a sentence can be positive, negative and neutral. In general sense, this is derived based on two measures: a) Polarity and b) Subjectivity.

Polarity score ranges between -1 and 1, indicating sentiment as negative to neutral to positive whereas Subjectivity ranges between 0 and 1 indicating objective when it is closer to 0 – factual information and subjective when closer to 1.

Stanford NLP is built on Java but have Python wrappers and is a collection of pre-trained models. Let’s dive into few instructions…

  1. As a pre-requisite, download and install Java to run the Stanford CoreNLP Server.
  2. Download Stanford CoreNLP English module at https://stanfordnlp.github.io/CoreNLP/download.html#getting-a-copy
  3. Navigate to its path in your downloaded folder. Unzip the files. Go to your command prompt and type the following command to run its server. Note: -mx4g option is to state 4 gigabytes memory to be used.
java -mx4g -cp "*" edu.stanford.nlp.pipeline.StanfordCoreNLPServer -port 9000 -timeout 50000

Launch your Python Jupyter notebook or IDE (Ex: Spyder) and run down this code. Ensure you install StanfordCoreNLP package using PIP install command.

from pycorenlp import StanfordCoreNLP

nlp = StanfordCoreNLP('http://localhost:9000')

text = "The intent behind the movie was great, but it could have been better"
results = nlp.annotate(text,properties={
        'annotators':'sentiment, ner, pos',
        'outputFormat': 'json',
        'timeout': 50000,
        })

for s in results["sentences"]:
    print("{} : {}".format(" ".join(t["word"] for t in s["tokens"]),s["sentiment"]))

Annotate allows us to call specific NLP tasks such as Sentiment analysis. It returns output in JSON format.

Once you run the code, you can terminate the Java server by typing Ctrl + C and hitting enter in the command prompt.

Stanford NLP supports multiple languages other than English. You can follow the documentation provided at https://stanfordnlp.github.io/CoreNLP/

For a sample quick analysis, try this link which connects you to Stanford NLP http://corenlp.run/ instance. Type a sentence and explore the visual representation of some of the analysis.

You can refer the same sample code on my GitHub: https://github.com/coffeewithshiva/Sentiment_Analysis_Stanford_NLP

On Textblob, I came across the below GitHub which might be extensively useful: https://github.com/shubhamjn1/TextBlob/blob/master/Textblob.ipynb

Happy NLP!

Top Use Cases of AI in Business

It appears as if the movie – Terminator – was released quite recently and many of us have talked about if machines could help us in our daily chore activities and supporting business operations.

Fast forward! We’re already realizing few changes around us where artificial intelligence enabled systems help us in many ways and the potential of it looks bright few years down the road.

I was researching about few top use cases of AI in business a couple of weeks. I thought to share it here and I’m sure you’re going to be excited to read & share.

Top Use Cases of AI in Business

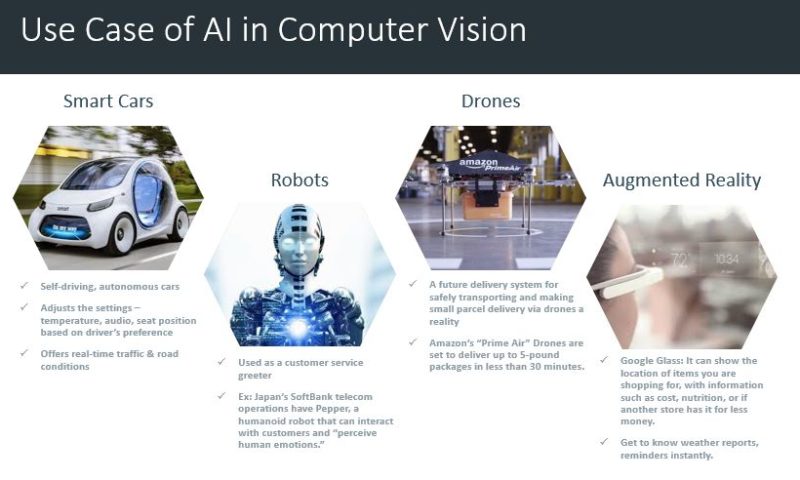
1. Computer Vision – Smart Cars (Autonomous Cars): IBM survey results say 74% expected that we would see smart cars on the road by 2025. It might adjust the internal settings — temperature, audio, seat position, etc. — automatically based on the driver, report and even fix problems itself, drive itself, and offer real time advice about traffic and road conditions.

2. Robotics: In 2010, Japan’s SoftBank telecom operations partnered with French robotic manufacturer Aldebaran to develop Pepper, a humanoid robot that can interact with customers and “perceive human emotions.” Pepper is already popular in Japan, where it’s used as a customer service greeter and representative in 140 SoftBank mobile stores.

3. Amazon Drones: In July 2016, Amazon announced its partnership with the UK government in making small parcel delivery via drones a reality. The company is working with aviation agencies around the world to figure out how to implement its technology within the regulations set forth by said agencies. Amazon’s “Prime Air” is described as a future delivery system for safely transporting and delivering up to 5-pound packages in less than 30 minutes.

4. Augmented Reality: Ex: Google Glass: It can show the location of items you are shopping for, with information such as cost, nutrition, or if another store has it for less money. Being AI it will understand that you’re likely to ask for the weather at a certain time, or want reminders about meetings so it will simply “pop up” unobtrusively.

5. Marketing Personalization: Companies can personalize which emails a customer receives, which direct mailings or coupons, which offers they see, which products show up as “recommended” and so on, all designed to lead the consumer more reliably towards a sale. You’re probably familiar with this use if you use services like Amazon or Netflix. Intelligent machine learning algorithms analyze your activity and compare it to the millions of other users to determine what you might like to buy or binge watch next.

6. Chatbots: Customers want the convenience of not having to wait for a human agent to handle their call, or wait for a few hours to be replied to an email/twitter query. Chatbots are instant, 24×7 available & backed by robust AI offering Contextually relevant personalized conversation.

7. Fraud Detection: Machine learning is getting better and better at spotting potential cases of fraud across many different fields. PayPal, for example, is using machine learning to fight money laundering.

8. Personal Security: Airports – AI can spot things human screeners might miss in security screenings at airports, stadiums, concerts, and other venues. That can speed up the process significantly and ensure safer events.

9. Healthcare: Machine learning algorithms can process more information and spot more patterns than their human counterparts. One study used computer assisted diagnosis (CAD) when to review the early mammography scans of women who later developed breast cancer, and the computer spotted 52% of the cancers as much as a year before the women were officially diagnosed.

Data Extraction Limitations of Radian6, Sysomos That You Need To Know!

Application of Social Media Listening Tools

Social media data is vast – we all agree. As per this blog, 12.9M texts, 473k data in Twitter, 49k in Instagram, to call out a few sources, have been created in a single minute in 2018!

Text Analytics projects, notably, Social Media Analytics involves extracting huge data relevant to a particular industry/context. Some of the business objectives could be

(a) to identify the emerging trends from these conversations,

(b) to understand the sentiment of a specific brand/event etc.

A quick idea to extract the data from say Twitter, Instagram could be to register the API of individual sources and pull the data that we’re looking for. For selected blogs, forums, we may have to write a web scraping scripts using Python.

What if, there’s an aggregator which pulls massive data across the sources including the historical/past years data? In the market, there are popular social media listening tools such as Radian6 and Sysomos that cater to this requirement. Those tools index the data for every defined frequency and allows us to extract the data.

It would be a topic on another day about how to extract the data on Radian6 or Sysomos. In this article, I would like to list down the data limitations or constraints that I came across so far. By knowing these key constraints, you might plan your extraction phase of your project accordingly.

By the way, Radian6 was acquired by Salesforce and the product was then renamed & released as “Social Studio”.

Data Extraction Limitations of Salesforce Social Studio (formerly, Radian6)

1) In a single day, we can either extract 500k data or 3 months timeline at a single go, whichever is lower. If you want to extract 1 year of data on the topic “Indian Premier League” for instance, you can add the keywords and extract by 4 quarters – at the end, you would have four files indicating four quarters.

2) For Twitter, we can download only 50k data in a single day. Post that limit, it can only extract the External Ids using which we might need TweetPy to pass on the ids and fetch the corresponding tweets.

There’s a good possibility that, say, you have 10k tweets for the time period Jan – Dec 2015 on a selected topic/keywords extracted via Social Studio today, and when you run those external ids using TweetPy, just don’t get surprised if the data volume has reduced significantly. Time & again, Twitter removes the spam tweets and blocks the concerned users! Hence, you might see this mismatch in those numbers which is fine – we don’t really want to have the spam messages, after all.

Since Social Studio had historically indexed those spam tweets/blocked users, we can’t do anything about it. Wish if there was a feature built-in as part of this tool to check back on Twitter if those users were not blocked at least twice in a year to remove a major portion of junk data 🙂

Data Extraction Limitations of Sysomos

1) For Twitter, Forums, Blogs, News and Tumblr, the historical data can only go back up to 13months.

2) For youtube, the download limit for the mentions is 500 while for all the other sources, the download limit is 50,000 mentions per export. So, we need to shorten our date range and download the data in case if it exceeds 50k limit.

3) For Facebook and YouTube, the date limitations are what the API allows us to go back from so we cannot give an exact date.

Observations

1) Social Studio could extract the rolling 3 years data whereas Sysomos gives us the last 13 months.

2) Sysomos has sources such as Instagram and none of these listening tools have Pinterest yet.

3) We can’t add the data source, be it a new blog/forum, and hence we end up doing web scraping for custom requirements or websites.

4) The more generic keyword your input is, the more spam/irrelevant data your outcome would be! So, that’s the key challenge here. A case in point, for one of the products we’re extracting – “Kitchen Sink” – there are lots of idioms/phrases being pulled out. Ex: “Let it sink for a minute”. There’s an album called Kitchen Sink as well :). So, all these spams got to be cleaned prior to subsequent analyses.

Based on your requirements, you can choose the tool and extract the desired data.

P.S: The limitations would keep changing/being updated by the respective tools. I’ve written these based on the past 6 months usage.

Quite often, I hear these terms are being used interchangeably.

Are there any differences between dimensions, measures, metrics and KPI (Key Performance Indicator)? Yes, there are!

Let’s take a simple example to know what these terms actually mean.

If you’re the Sales Leader of a company, you would be interested to know the performance of a particular product line in a certain year. Let’s say, the sales of a particular version of Mi Mobile is registered as 250,000 units on a flash sale held online. In this case, the dimension is referred to the product type which is Mi Mobile whereas 250,000 units is the measure (aka values).

How about Metrics (aka Business Metrics) and KPI?

Business sets a target/objective every year for its product lines. The idea is to create & drive its strategies to realize the objectives throughout the year. Metric is a way to assess the performance of a particular division or at the company level. #Revenue is one of the business metrics and is assessed by comparing against its previous year, industry standards (benchmarks), competitors.

There can be multiple metrics a company can devise and track during the year. However, there has to be certain “key” metrics which the business wants to keep a tab on a frequent basis. Those key performance metrics determine the health of the organization. In the event of any way off from the objectives, the business strives hard to do a course correction on its strategies.

KPI or simply a metric is a combination of 2 or more measures.

A simple KPI can be, #Sales of Mi Mobile in 2017 against the previous year. Assume the target set by the business in 2017 to be 500,000 units in a geographical location. The business can validate and see where they can invest further to grow their sales numbers. Popular Brands like Mi which sells primarily on online eCommerce websites have now ventured into offline stores for further growth.

For the Services industry, Customer Retention Rate would be the key. After all, retaining a customer costs relatively lesser than acquiring a new customer. Companies focus on retaining the most profitable customers as they bring in the maximum value for the top-line of the business.

Your KPI should be well defined and relevant to the business. Notably, the corresponding business stakeholders should be aligned on the same as well. A good KPI will definitely add value in measuring your performance of the business as it’s quantifiable. A bad KPI might mislead you from the focus & achieving your target.

A Scorecard or a Dashboard can be used to keep a track of the KPI metrics on a daily/weekly/monthly/quarterly/yearly basis. There are tools such as Tableau Public, MS Power BI to load your visualizations and share it among the stakeholders.

What’s trending: Big Data vs Machine Learning vs Deep Learning?

If you’re new to Analytics, you might encounter too many topics to explore in this particular field starting from Reports, Dashboards, Business Intelligence to Data Visualization to Data Analytics, Big Data to AI, Machine Learning, Deep Learning. The list is incredibly overwhelming for a newbie to begin his/her journey.

I really wanted to rank and check which one is currently trending relative to each topic among these five buzzwords: “Business Intelligence”, “Data Analytics”, “Big Data”, “Machine Learning”, “Deep Learning”.

I made use of my favorite Google Trends tool for my reference purpose. I’m interested to assess based on the worldwide data for last 5 years using “Google” search engine queries as the prime source.

Analytics Trends 1
Analytics Trends 1

I inferred the following from the above user-searched data:

  1. Big Data stayed at the top of the users’ mind for quite long time since 2012. However, Machine Learning is soaring higher from 2015, and it could potentially overtake Big Data in a year as the “hottest” skill-set to have for any aspiring Analytics professional.
  2. Deep Learning is an emerging space! It would eventually gain more momentum in 1 year from now. It’s essential to gain the knowledge of Machine Learning concepts prior to learning about Deep Learning.
  3. Needless to say, Data Analytics field is also growing moderately. For beginners, this could be the best area to begin your journey.
  4. BI space is starting to lose out its focus among the users thanks to self-service BI portals (and automation of building reports/dashboards), Advanced Analytics.


I happened to see few additional interesting insights when I drilled it down at the industry-wise.

  1. Data analytics is still the hot topic for Internet & Telecom
  2. Big data for Health, Government, Finance, Sports, Travel to name a few
  3. BI for Business & Industrial
  4. Machine Learning for Science


Users interest by Region says that China is keen on Machine Learning field and Japan on Deep Learning. Overall, Big Data still spread all over the world as the hot-topic for time being. Based on the above graphs, it’s quite evident that Machine Learning would turn out to be the top-most skill set for any Analytics professional to have at his/her kitty.

You can go through this Forbes article to understand the differences between Machine Learning and Deep Learning at a high level.

Pls let me know what you think would be the hottest topic of interest in the Analytics spectrum.

Google Introduces Natural Language Queries In The Docs “Explore” Tool

Google Docs Explore feature was first introduced last year, and it aids us while drafting documents, spreadsheets, slides to a good extent. In this article, I’d like to share few stuffs around how to use Google docs “Explore” feature on a spreadsheet. It uses machine learning algorithm to understand the natural language based text queries and delivers the outcome instantly!

Isn’t it cool if you could just use natural language texting to understand the top, bottom and basic statistics in a matter of few seconds?! Needless to say, it also recommends us to refine the queries further 🙂

For illustration purpose, here’s a simple example:

I’ve created a sample data depicting the students’ scorecard. It comprises of student names, subjects and the corresponding scores. If you click on the headers and navigate to Explore option at the bottom-right corner of the Google Spreadsheet screen, it would pop-up and recommend us the queries that we might be interested in.

Google Doc Explore 1

Some of the questions can be:

a) Top Score,

b) Least Score or Bottom Score,

c) Unique Subjects

d) Average of Score by Subject

e) Histogram of Score

f) Bar Chart of Average Score by Subject

You can start exploring the available fields using this way. I believe it can be a handy tool if you use Google spreadsheet for your projects. It also allows us to customize the generated formula as per below screenshot. The syntax looks pretty much like an SQL programming.

Google Doc Explore 2

You can also make use of this feature as part of your exploratory data analyses. And here’s another classic example for you:

If you’re a teacher/head of the school, you would be surprised to see the below distribution Average Score vs. Subject. The tool provides us the insight that Physics has got the lowest score among other subjects. This is just the starting point to your analysis to go deeper into the data, and uncover the patterns. One of the key decisions from this inference could be to refine your education methodologies for ‘Physics’ subject.

Google Docs Explore 3

Go ahead and explore the Google’s Explore feature and let me know how it helps you!

Credits:

Article’s cover page: http://alicekeeler.com/2016/09/30/google-docs-not-research-tool-explore/

Machine Learning Algorithm, Flash Fill, in Excel

Data analysis of any sort requires cleaning and formatting the data.

Predominantly, Microsoft Excel spreadsheet can be used for that matter. The source of data could be from multiple upstream systems! It’s highly unlikely that you would just get the data ready for further processing.

Let’s take a hypothetical example:

A fashion based e-commerce startup wants to identify which top 3 cities in a specific country has returned back the maximum products to their retailers. The company then might be interested to scrutinize the problems faced by its customers, and takes key decisions to minimize the returns or strengthens the returns policy to prevent the losses incurred by the same.

The returns team of that company maintains one relevant field by the name: “Address”. In the excel sheet, it would be a manual and repetitive task to extract the City/State/Pincode from the Address. Of course, one can use the combination of MID, FIND kind of formulas to extract what we want to an extent. Well, there’s still a better way in Microsoft Excel 2013 and above versions.

It’s called “Flash Fill” concept designed by Dr. Sumit Gulwani, Microsoft Researcher. This is a machine learning algorithm and discovers patterns based on a couple of data examples and populates the remaining data using what it had learned! This is a great deal of time saver for many cases. I’ll highlight an example below.

Using the available Address, we can now extract County/City/State/Pincode using Flash Fill feature.

  1. Create a new field/variable and name it. I created “County” for my requirement.
  2. I just typed three records manually such as Orleans, Livingston, Gloucester.
  3. Then, I highlighted these three and dragged the text until the end of the records. You can see below that it just replicated the three words repeatedly.
  4. At the end of this screenshot, you can see a tab that appeared to enable you to choose few more options.
  5. Click “Flash Fill” and see the magic for yourself :). It has identified the pattern that I’m interested to extract only the County information from the Address field. You can similarly try to extract other key info such as State, Pincode.

Flash Fill - Step 1
Flash Fill – Step 1

Flash Fill - Step 2
Flash Fill – Step 2

In certain cases, the Flash Fill automatically pops-up and recommends while you type the sample data as per below.

Flash Fill
Flash Fill

You can apply Flash Fill to format your number such as Telephone number, Social Security Number etc. to name a few.

A couple of tips:

  1. If it fails to identify pattern in your case, educate it by typing few more examples for “Flash Fill” to learn from it. Usually, I type 2 or 3 examples and the algorithm picks up thereafter for the remaining data.
  2. In the above example, I had a separator such as comma to differentiate the county, state, pincode info in the Address field. So, it became pretty easier for “Flash Fill”.  Alternatively, you can iterate few more times to clean the data as per your wish.

The purpose of forecasting or prediction is to take an informed decision today based on the past historical information that we have.

Most often, I think what can be the differences between forecasting and prediction or predictive analytics. Are you too confused? Please read on…

Apart from being the buzzwords among the business people, are there any differences in their definitions, usage? Based on what I explored by going through few articles on the web, these are my findings:

  1. Forecasting is a generic term used by professionals across various disciplines. It applies at the high-level. For ex: What could be the total sales for a particular product line in next quarter? It uses time series data. Another classic example could be weather forecasting for next week. It involves time as a dependent variable.
  2. Predictive analytics is a term hugely became popular in the analytics space. It can be done at a much granular level: For ex: A credit card company would be interested to predict – Which customers might default during the New Year festival session? Notwithstanding that, predictive analytics helps us in understanding the relationship between variables using regression method.


Another interesting perspective on the difference which I read is as follows:

Forecasting is all about numbers – Again, the total sales example which I pointed above. Prediction is more on the behavior – In Amazon website, you must have seen the recommendation engine. Although it involves more of Machine Learning concepts (which improves/learns by itself), it recommends, say, the books based on what I had earlier purchased on the same website. The latter categorizes based on what genre, author I would be interested to read. In fact, I discovered some amazing books thanks to Amazon’s intelligent recommendation engine!

What’s your take on Forecasting vs. Predictive Analytics?

If you’ve gone through the list of data science skills, you would be surprised as to where to begin this journey. I’ve been pondering on the same thought for quite some time!

I discovered a timeline chart in the form of an infographics released by Kunal Jain of AnalyticsVidhya fame. It depicts the list of stuffs that one can learn step by step on a monthly basis. Although it was prepared in Jan 2016, I think it still looks relevant, and we can make use of it as a goal plan. Welcome, on board! Let’s do this!!

How To Become Data Scientist by AnalyticsVidhya

The emphasis should be focused on understanding the concepts, techniques rather than merely knowing how to program them. I think that tools/programming might get changed over the period of time. What doesn’t get changed are the basics which applies to any domain/field.

There are plenty of ways one can learn these from. I think, to learn a complex course like these, MOOC (Massive Online Open Courses) is the best way followed by peer group learning, YouTube videos/blog tutorials, e-books/text books.

How are you preparing yourself to become a data scientist?

Top Data Science Skills By Job Role

Do you have a fair idea about data science? I hope, yes. How about its skill-sets?

For newbies, Data Science is the field which is intersecting Statistics, Mathematics, Programming/Technology and Business. Using a combination of all these components, insights, models can be drawn using the data. It was a term coined in 2001 by a Professor of Statistics, William S. Cleveland at Purdue University.

I read at least 5 articles from the web today to understand the nuances of this role. Little did I know prior to my research that there are lot many things attached to the buzzword “Data Science”.

Broadly speaking, the skill-sets required to be a Data Scientist (as the way many companies call the folks who work in Data Science domain) fall under the following skills viz,

  1. Business
  2. Technology
  3. Math & Modelling
  4. Programming
  5. Statistics

We can even sub-classify them into further such as Programming – R, SAS, Python, SQL, NOSQL to name a few.

Business2Community features an article written by Bob Hayes. He came up with a questionnaire listing 25 data science skills, captured the responses, analyzed and ranked the top 10 skills from the results based on the proficiency level as “Intermediate” criterion.

25 Skills in the Data Science by AnalyticsWeek and BusinessBroadway

Top 10 Data Science skills in general are:

  1. S – Communication (87% possess skill)
  2. T – Managing Structured data (75%)
  3. M – Math (71%)
  4. B – Project management (71%)
  5. S – Data Mining and Viz Tools (71%)
  6. S – Science/Scientific Method (65%)
  7. S – Data Management (65%)
  8. B – Product design and development (59%)
  9. S – Statistics and statistical modeling (59%)
  10. B – Business development (53%)

It’s interesting to note the fact that Communication stands first when compared to other skills! Catering either to internal or external customers, the data scientists talk to business functions such as Marketing, HR, Operations, Finance etc.I think it makes sense because what’s the point if one works hard at developing a model but not conveying the results as per the business needs. Guess what? “Data Presentation” has become one of the top 10 skills in 2016 published by LinkedIn.

Bob also charted out the top skill sets by job role level. This one is another interesting perspective.


Top Data Science Skills by Job Role from Business Broadway

Researcher can focus more on Statistics; Business Manager on communication, project management; Developer mostly on the programming aspects and so on.

With that said, it’s very tough to focus on learning all the skill-sets of a typical data scientist at a single stretch. Depends on who you want to become, the above list would be beneficial for you. Hence, you can prioritize and narrow down to the list and start learning one at a time! If you’re already good at Statistical concepts, try learning how to program the techniques using “R” programming language. This way, I think one can steadily adapt to the data science skill-sets.

Please remember that there’s no one size fits all approach! If your buddy is good at programming because of his formal educational background being from a software discipline and moving faster on a learning curve, that’s perfectly okay for you to keep up at your pace depending on your comfort level. At the core of data science, you can be really good at one skill-set and know the basics & become eventually to an intermediate level at another skill-sets.

My focus will be on statistics to begin with. What is yours right now?